I want to perform a cluster analysis using the HierarchicalClustering package. Is there a way to display the inter-cluster distances in a dendrogram plot?
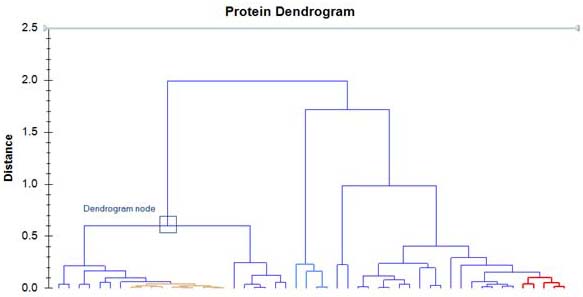
An example how the result should look like:  .
.
DendrogramPlot accepts Axes as an option. Despite syntax highlighting in red of Axes and AxesOrigin, GridLines etc. these options seem to work with DendrogramPlot.
Inter-cluster distance in a Cluster object is given as the third element.

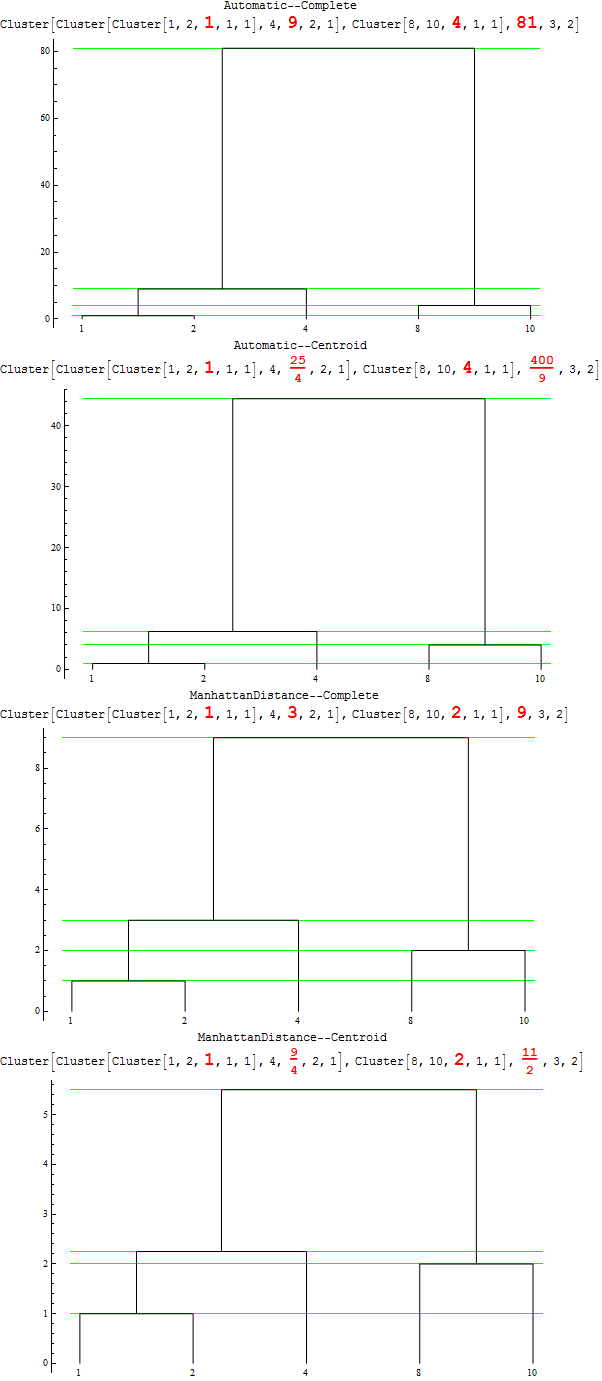
Several combinations of DistanceFunction and Linkage where inter-cluster distances are highlighted in red and shown as green gridlines in the dendogram plot:
Needs["HierarchicalClustering`"]

Grid[{{ToString@#[[1]] <> "--" <> #[[2]]},
  {Replace[ Agglomerate[{1, 2, 10, 4, 8},
    DistanceFunction -> #[[1]], Linkage -> #[[2]]],
    Cluster[a_, b_, c_, d__] ->
    Cluster[a, b, Style[c, 18, Red, Bold], d], {0,
    Infinity}]}, {DendrogramPlot[{1, 2, 10, 4, 8},
   DistanceFunction -> #[[1]], Linkage -> #[[2]],
   LeafLabels -> (# &),
   GridLines -> {None, Cases[Agglomerate[{1, 2, 10, 4, 8},
       DistanceFunction -> #[[1]], Linkage -> #[[2]]],
      Cluster[a_, b_, c_, d__] :> c, {0, Infinity}]},
   GridLinesStyle -> Green, ImageSize -> 500,
   Axes -> {False, True}, AxesOrigin -> {.75, Automatic}]}}] & /@
 Tuples[{{Automatic, ManhattanDistance}, {"Complete",  "Centroid"}}] // Column

So ... vertical axis does indeed measure the inter-cluster distances for a given DistanceFunction and Linkage.
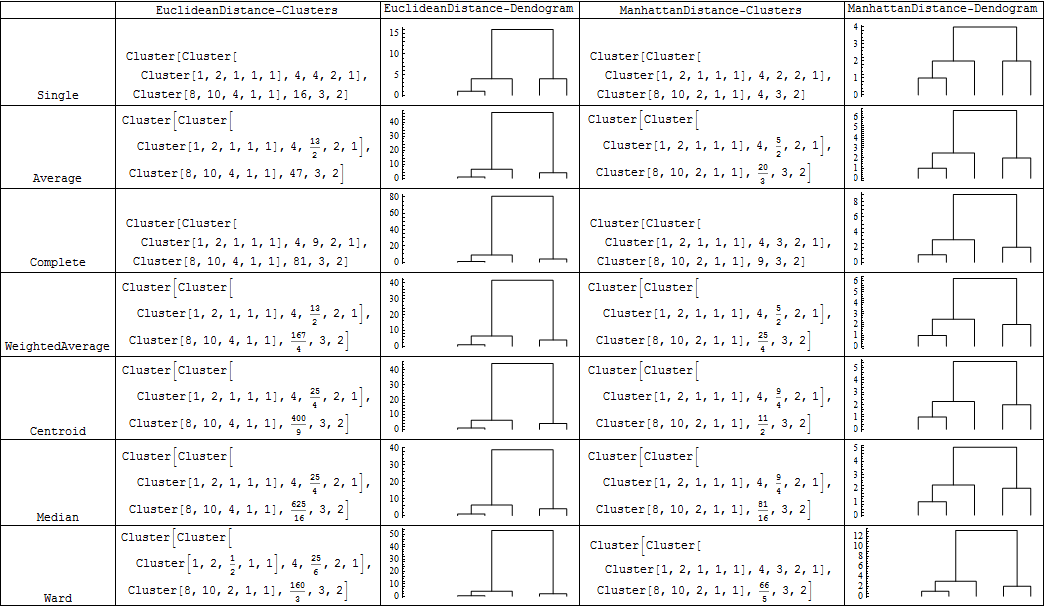
For various combinations of DistanceFunction and Linkage you get the following pictures:
{#, Agglomerate[{1, 2, 10, 4, 8}, DistanceFunction -> Automatic, Linkage -> #],
 DendrogramPlot[{1, 2, 10, 4, 8},
 DistanceFunction -> Automatic, Linkage -> #,
 Axes -> {False, True}, AxesOrigin -> {-1, Automatic}],
 Agglomerate[{1, 2, 10, 4, 8}, DistanceFunction -> ManhattanDistance, Linkage -> #],
 DendrogramPlot[{1, 2, 10, 4, 8},
 DistanceFunction -> ManhattanDistance, Linkage -> #,
 Axes -> {False, True}, AxesOrigin -> {-1, Automatic}]} & /@
 {"Single", "Average","Complete", "WeightedAverage", "Centroid", "Median","Ward"} //
 Grid[Prepend[#, {"", "EuclideanDistance-Clusters",
 "EuclideanDistance-Dendogram", "ManhattanDistance-Clusters",
 "ManhattanDistance-Dendogram"}],
  Dividers -> All, Alignment -> Bottom] &

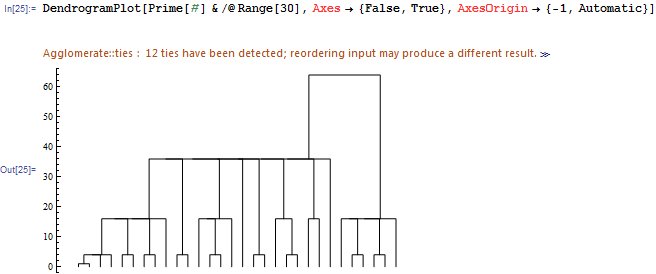
EDIT: What I get for Frederik's example in the comments:
DendrogramPlot[Prime[#] & /@ Range[30], Axes -> {False, True},
AxesOrigin -> {-1, Automatic}]

DistanceFunction and Linkage. I tried various combinations of DistanceFunction and Linkage, and the vertical tick labels seem to vary in expected ways... but I have not beenable to verify the exact mapping ... yet :)
$\endgroup$