Does anyone know if there is an option or function that can automatically format the output of ANOVATable and ParameterTable, but without using the Grid function ?
1 Answer
$\begingroup$
$\endgroup$
1
You can MapAt Style to specific Parts:
data = {{0, 1}, {1, 0}, {3, 2}, {5, 4}};
lm = LinearModelFit[data, x, x];

lm["ANOVATable"][[1, 1]]
(*{{"","DF","SS","MS","F\[Hyphen]Statistic","P\[Hyphen]Value"},
   {x,1,7.1228,7.1228,8.7552,0.09775},
   {"Error",2,1.6271,0.81355},
   {"Total",3,8.75}} *)

rowlabels = {1, 1, 2 ;;, 1};
collabels = {1, 1, 1, 1 ;;};
content = {1, 1, 2 ;;, 2 ;;};

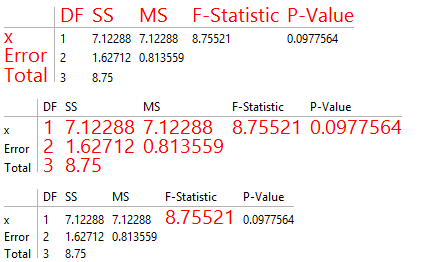
MapAt[Style[#, Red, 20] &, lm["ANOVATable"], {rowlabels, collabels}] (* labels *)
MapAt[Style[#, Red, 20] &, lm["ANOVATable"], {content}]  (* all content *)
MapAt[Style[#, Red, 20] &, lm["ANOVATable"], {{1, 1, 2, 5}}]  (* a specific part *)

Replace "ANOVATable" above with "ParameterTable" to apply styles to ParameterTable.
Note that lm["ANOVATable"][[1, 1]] is a ragged array; so you need to make sure that you have the right indices when styling individual pieces.
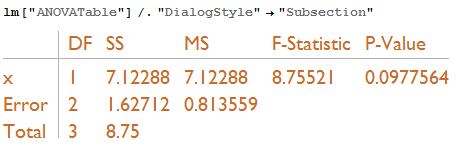
On related note, to change the CellStyle of the output generated by lm["ANOVATable"], you can use something like
lm["ANOVATable"] /. "DialogStyle" -> "Subsection"

-
$\begingroup$ Awesome answer. Thank you @kguler! $\endgroup$– stathiskCommented Jun 6, 2014 at 21:07

Grid? $\endgroup$