5
$\begingroup$

Bug introduced in 9.0 and fixed in 9.0.1


In Mathematica 7 it is very easy to conditionally suppress plotting of individual lines using If:

Plot[{
  If[x^2 < 2, x^2],
  If[Exp[x] > x^2, Exp[x]],
  If[False, x]                (* check recommended by Rahul *)
 },
 {x, -2, 2},
 PlotStyle -> Thick, Frame -> True]
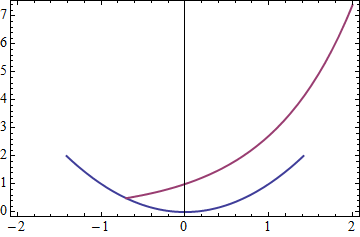
enter image description here

Or more verbosely using Piecewise and Indeterminate:

Plot[{
  Piecewise[{{x^2, x^2 < 2}}, Indeterminate],
  Piecewise[{{Exp[x], Exp[x] > x^2}}, Indeterminate],
  Piecewise[{{x, False}}, Indeterminate]      (* check recommended by Rahul *)
  },
 {x, -2, 2},
 PlotStyle -> Thick, Frame -> True]

enter image description here

It is reported that neither method works in version 9.0.0 (at least on OSX.) Furthermore it is reported that my attempt using ConditionalExpression also fails:

Plot[{
  ConditionalExpression[x^2, x^2 < 2],
  ConditionalExpression[Exp[x], Exp[x] > x^2]
  },
 {x, -2, 2},
 PlotStyle -> Thick, Frame -> True]

Plotting a zero is reported to "work" but that is hardly a solution:

Plot[{
  Piecewise[{{x^2, x^2 < 2}}],
  Piecewise[{{Exp[x], Exp[x] > x^2}}]
  },
 {x, -2, 2},
 PlotStyle -> Thick, Frame -> True]
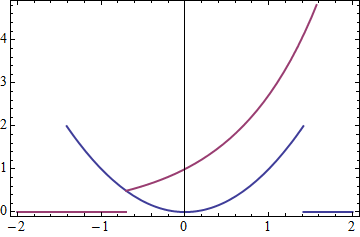
enter image description here

1. Is this indeed a bug in version 9.0.0?

2. Is there a workaround for the affected systems?

$\endgroup$
15
  • $\begingroup$ It seems to work unless I missed something. $\endgroup$
    – Szabolcs
    Commented May 16, 2014 at 17:32
  • $\begingroup$ @Szabolcs Which version are you using? A recent comment indicates this may be a bug in version 9.0.0. $\endgroup$
    – Mr.Wizard
    Commented May 16, 2014 at 17:34
  • 2
    $\begingroup$ @Szabolcs I agree - it works for me on OSX and version 9.0.1. $\endgroup$
    – Jens
    Commented May 16, 2014 at 17:34
  • 2
    $\begingroup$ @Mr.Wizard I'm using 9.0.1 (from the version string it's not very clear but 9.0.0 was released in November, and 9.0.1 in January). 9.0.0 had lots of bugs and I think no one should be using it ... there are many examples of bugs fixed in 9.0.1 on this site. $\endgroup$
    – Szabolcs
    Commented May 16, 2014 at 17:36
  • 2
    $\begingroup$ Going by Jens's and Szabolcs's comments it does seem like a bug that was fixed in 9.0.1 then. I didn't know 9.0.0 was so well known to be bug-ridden. $\endgroup$
    – user484
    Commented May 16, 2014 at 17:54

2 Answers 2

2
$\begingroup$

Since this bug seems to be tied directly to the appearance of Indeterminate as the only available function value in the plot range, it could perhaps be considered a work-around to replace Indeterminate by another "quantity" that behaves the same way as Indeterminate but doesn't cause the whole display of all other functions to be suppressed.

I tried the following, and it works on version 9.0.0:

Plot[{Piecewise[{{x^2,x^2<2}},Indeterminate],
  Piecewise[{{Exp[x],Exp[x]>x^2}},Indeterminate],
  Piecewise[{{x,False}},I]      (*modified check recommended by Rahul*)},
 {x,-2,2},
 PlotStyle->Thick,Frame->True]

Here, I used the imaginary unit I to produce the same effect as Indeterminate, and the remaining plots do still get displayed.

To make this more general, maybe one can use a replacement rule like this:

Plot[Evaluate[{Piecewise[{{x^2, x^2 < 2}}, Indeterminate], 
    Piecewise[{{Exp[x], Exp[x] > x^2}}, Indeterminate], 
    Piecewise[{{x, False}}, 
     Indeterminate]      (*modified check recommended by Rahul*)} /. 
   Indeterminate -> I], {x, -2, 2}, PlotStyle -> Thick, Frame -> True]
$\endgroup$
0
$\begingroup$

In my Version 9.0 for Microsoft Windows (64-bit) (November 20, 2012) Release ID 9.0.0.0 (3868239, 384640), Patch level 0,

Plot[{ConditionalExpression[x^2,x^2<2],ConditionalExpression[Exp[x],Exp[x]>x^2]},{x,-2,2},PlotStyle->Thick,Frame->True]  

works normally, but neither

Plot[{If[x^2<2,x^2],If[Exp[x]>x^2,Exp[x]],If[False,x]                (*check recommended by Rahul*)},{x,-2,2},PlotStyle->Thick,Frame->True]  

nor

Plot[{Piecewise[{{x^2,x^2<2}},Indeterminate],Piecewise[{{Exp[x],Exp[x]>x^2}},Indeterminate],Piecewise[{{x,False}},Indeterminate]      (*check recommended by Rahul*)},{x,-2,2},PlotStyle->Thick,Frame->True]

do : only a frame for x=-2 to +2 and y from -1 to +1 get plotted (with x=0 and y=0 line).
Does that make sense?

$\endgroup$

Your Answer

By clicking “Post Your Answer”, you agree to our terms of service and acknowledge you have read our privacy policy.

Not the answer you're looking for? Browse other questions tagged or ask your own question.