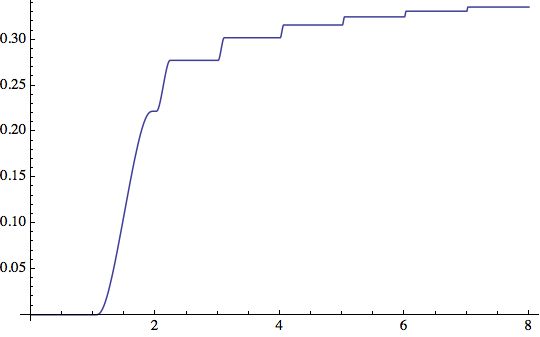
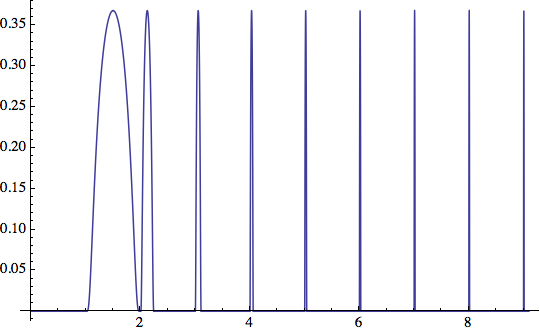
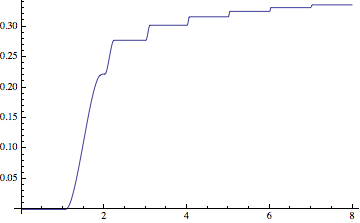
I'd like to plot the function $f$ in this answer https://math.stackexchange.com/a/788818/66096
Let $h(x) = \begin{cases} e^{ -\frac{1}{1 - (1-2x)^2}} & \mbox{ for } 0<x < 1\\ 0 & \mbox{ otherwise} \end{cases}$ Then let $$g(x)=\sum_{n=1}^\infty h(n^2(x-n))=\begin{cases}h(n^2(x-n))&\text{if }n\le x<n+1, n\in\mathbb N\\0&\text{otherwise}\end{cases}$$ And let $f(x)=\int_0^xg(t)\,\mathrm dt$.
I only know the basics of Mathematica, so I've been trying to plot piecewise functions without success.
Here is what I got
h[x_] = Piecewise[{{E^(-(1 - (1 - 2 x)^2)^(-1)), 0 < x < 1}, {0,
    x > 1}, {0, x < 0}}]
But how do I deal with $g$ ? I could input partial sums with the series expression, but at the same time, I could save computations by just defining it piecewise.


g[x_]=h[Floor[x]^2 (x-Floor[x])]? $\endgroup$