2
$\begingroup$

I want to plot a Wiener process $B=(B_{t})_{t≥0}$ and its running maximum $S_{1}=\max_{0\leq t\leq1}B_{t}$ on Mathematica. Can anybody help? I only know how to generate a Wiener process using RandomFunction, but I have no idea how to plot its running maximum.

thank you! any help is appreciated

edit: Thank you for the answers! How do I plot the reflected process $S-B$ ? Is there a command that given the two graphs, outputs their difference?

$\endgroup$
3
  • 1
    $\begingroup$ Well, okay, show us what you have made so far :) $\endgroup$
    – Sektor
    Commented Apr 1, 2014 at 14:46
  • $\begingroup$ You could try using FoldList[Max, .... over the list of values generated with RandomFunction $\endgroup$
    – Rojo
    Commented Apr 1, 2014 at 15:05
  • $\begingroup$ ListLinePlot[RandomFunction[WienerProcess[], {0, 1, 0.01}], AxesOrigin -> {0, 0}] I get the Wiener Process with this. $\endgroup$
    – user139493
    Commented Apr 1, 2014 at 15:20

3 Answers 3

6
$\begingroup$

It is always nice to have alternative solutions. The following sets up a function which holds its value until a larger value is presented to it.

rMax[ts_] :=
 Block[{max = -\[Infinity], rmax},
      rmax[x_ /; x <= max]:= max;
      rmax[x_]:= (max = x; x);
      rmax /@ ts
 ]

Lets generate some data and extract out the states.

SeedRandom[1321];
s = RandomFunction[WienerProcess[], {0, 1, .001}]["PathStates"];

for convenience, since the data runs from zero to one, we can set the DataRange rather than constructing ordered pairs.

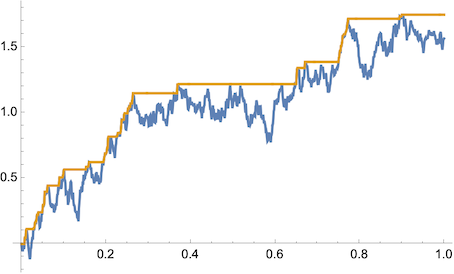
ListLinePlot[{s, rMax[s]}, DataRange -> {0, 1}]

enter image description here

Hopefully there will be some helper functions for working with TemporalData in future versions of M that will make all of this easier!

$\endgroup$
2
  • $\begingroup$ Thank you! can you see if you can help with the edit to my question? I kind of answered myself by doing: ListLinePlot[{s, rMax[s], rMax[s] - s}, DataRange -> {0, 1}]. Is that alright? $\endgroup$
    – user139493
    Commented Apr 1, 2014 at 21:04
  • $\begingroup$ Yes, that is correct. $\endgroup$
    – Andy Ross
    Commented Apr 2, 2014 at 3:27
4
$\begingroup$
Module[{s=4},
  Show[
  ListLinePlot[{SeedRandom[s];RandomFunction[WienerProcess[],{0,1,0.01}]},AxesOrigin->{0,0}],
  ListLinePlot[{SeedRandom[s];Apply[Transpose[{#1,FoldList[Max,First[#2],Rest[#2]]}]&,
    Transpose[First[Normal[RandomFunction[WienerProcess[],{0,1,0.01}]]]]]},AxesOrigin->{0,0}]]]

Some, ahem, fannying around with First[Normal... to dig out the actual time series pairs is required.

$\endgroup$
1
  • $\begingroup$ Thank you very much, the result is exactly what I wanted. I'm a very beginner with mathematica but needed to implement my school project with graphs. The code you wrote looks very complicated, I thought it would have been easier ^^, anyway thank you! it looks like I will have to spend a lot of time on this.. $\endgroup$
    – user139493
    Commented Apr 1, 2014 at 15:43
1
$\begingroup$

With Andy Ross' data

SeedRandom[1321];

a = RandomFunction[WienerProcess[], {0, 1, .001}]["PathStates"];

Using AccumulateApply by Ian Ford and Jon McLoone

AccumulateApply = ResourceFunction["AccumulateApply"];

b = AccumulateApply[Max, a];

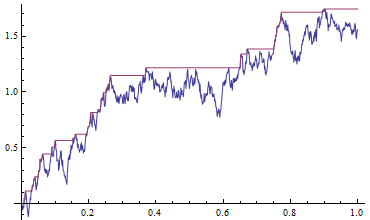
ListLinePlot[{a, b}, DataRange -> {0, 1}]

enter image description here

$\endgroup$

Your Answer

By clicking “Post Your Answer”, you agree to our terms of service and acknowledge you have read our privacy policy.

Not the answer you're looking for? Browse other questions tagged or ask your own question.