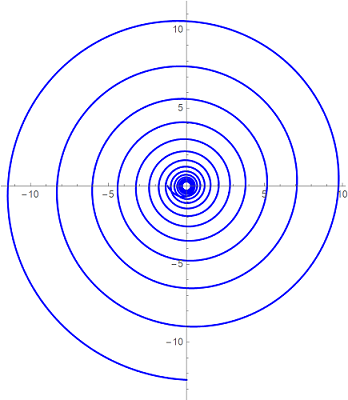
I was trying to visualize the idea of convergence/divergence of series using complex plane. I got this idea from “A First Course in Complex Analysis with Applications by Dennis Zill, Patrick Shanahan”. I used the command:
ComplexListPlot[Table[(0.9 I)^(n + 1)/n, {n, 1, 70, 0.01}],Joined -> True, PlotRange -> All,
 PlotStyle -> {Blue, Thick}]
to generate a plot as shown below:
Alternatively, one can use the command
ListLinePlot[Table[ReIm[(1.1 I)^(n + 1)/n], {n, 1, 70, 0.01}],
 PlotRange -> All]
to generate the same. This series is convergent as it kind of spirals down. If we change 0.9i to 1.1i, the plot changes to
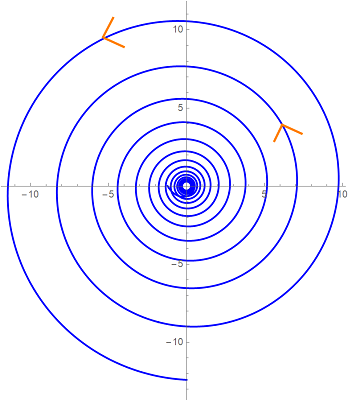
which signifies that the series is divergent. What is want is that some sort direction as to which way the sequence goes, like these:
How can this be achieved in mathematica?
Thanks in advance.
Edit:
Taking inspiration from the answer provided by @kglr , I have written a program to explore the idea of radius of convergence. Here is the code:
AnimatedPlot4Real1 = Animate[ListLinePlot[Table[\!\(
\*UnderoverscriptBox[\(\[Sum]\), \(n = 0\), \(n\)]\(
\*SuperscriptBox[\((
\*FractionBox[\(2\), \(3\)])\), \(n\)]
\*SuperscriptBox[\((x)\), \(2\ n\)]\)\), {n, 1, 500, 1}],
    ImageSize -> Large,
    PlotStyle -> {Red, Arrowheads[Thread[{.03, {.1, .5, .9}}]]},
    AxesStyle -> Directive[Black, Thick],
    TicksStyle ->
     Directive[Thick, FontSize -> 16, FontFamily -> "Comic Sans MS"],
    AxesLabel -> {Style["No. of terms in summation", 16,
       FontFamily -> "Comic Sans MS"],
      Style["Sum of the function", 16, FontFamily -> "Comic Sans MS"]},
    PlotLabel ->
     StringForm[
      "Check for convergence/divergence of \
\!\(\*UnderoverscriptBox[\(\[Sum]\), \(n = 0\), \
\(n\)]\)(\!\(\*FractionBox[\(2\), \(3\)]\)\!\(\*SuperscriptBox[\()\), \
\(n\)]\)(x\!\(\*SuperscriptBox[\()\), \(2  n\)]\) with x= ``.", x],
    LabelStyle ->
     Directive[FontSize -> 12, Bold, Black,
      FontFamily -> "Comic Sans MS"],
    ImagePadding -> {{Automatic, Automatic}, {Automatic,
       Scaled[0.05]}}] /.
   Line -> Arrow, {x, 1, 1.3, 0.01}, AnimationRunning -> False,
  AnimationRate -> 0.01]
This is based on Problem 5 in Problem Set 5.1 Advanced Engineering Mathematics (10th Edition) by Erwin Kreyszig, which has radius of convergence of $x<\sqrt{\frac{3}{2}}$. As the value of the x crosses the this threshold, the plots goes to very high value, indicating that the series diverges. The arrows points to direction where the series sum is headed.
Feel free to use this, if anybody found that its useful.


