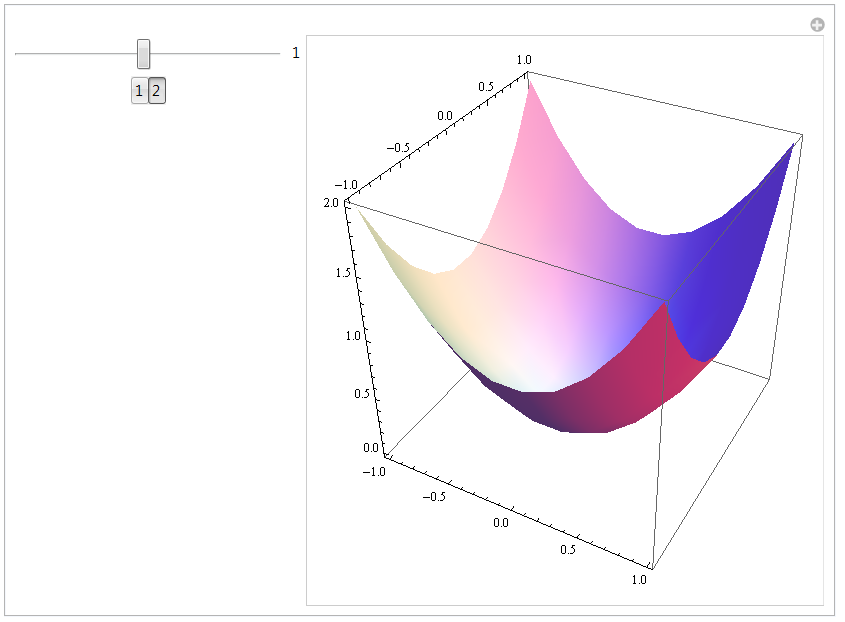
I have a Manipulate within which the plot does not render completely initially:
Manipulate[
 tick;
 If [ bRefreshPlot, (
     plot = ParametricPlot3D[ {u, v, u^2 + av (-1)^fn v^2}, {u, -1, 1}, {v, -1, 1} ] ;
   bRefreshPlot = False )
  , ] ;
 plot
 , Grid[{
   { Slider[ Dynamic[av, ( av = # ; bRefreshPlot = True ; tick = Not[tick]) &] , {0.05, 2} ], Dynamic@av },
   { SetterBar[Dynamic[fn, ( fn = # ; bRefreshPlot = True ; tick = Not[tick]) &] , Range[2] ] }
 }]
 , {{tick, False}, None}
 , {{av, 1}, None}
 , {{bRefreshPlot, True}, None}
 , {plot, None}
 , {{fn, 2}, None}
 , TrackedSymbols :> {tick}
 , ControlPlacement -> Left
 ]
Initially, the Manipulate output looks like:

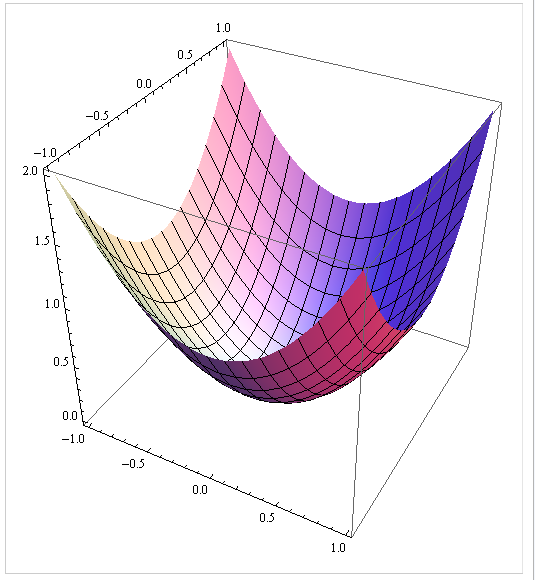
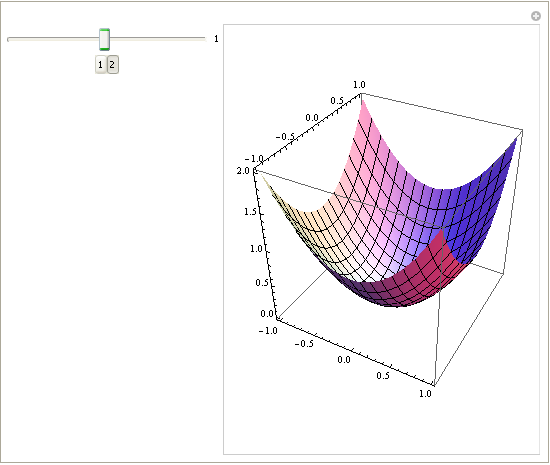
but after clicking each of the SetterBar buttons in sequence (toggling from paraboloid to saddle and back), the grid lines then show up as in:

I appear to be able to use 'SaveDefinitions -> True' to work around the initial display oddity. However, this lack of grid lines also occurs after adjusting the slider. After an adjustment of the slider, the plot is first rendered without grid lines, but after doing the same two-click toggle of the SetterBar buttons, the plot shows up properly with the grid lines?

