Possible Duplicate:
Difference in Plot when using Evaluate vs when not using Evaluate
Assume one has vector of functions (e.g., vec={x,x^2}).
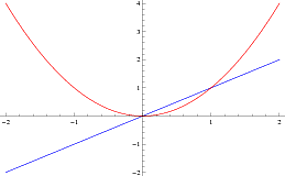
The command Plot[vec, {x, -2, 2}, PlotStyle -> {Blue, Red}] allows one to plot curves in different colors.

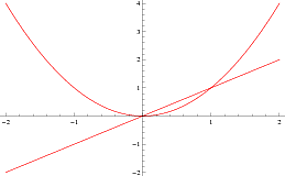
Any use of the replacement operator, however, causes all curves to adopt the final listed color. For example, Plot[vec /. x -> y, {y, -2, 2}, PlotStyle -> {Blue, Red}] gives

How does one specify different colors for different curves if a replacement (/.) is used within the plot command?
