24
$\begingroup$

Usually, when I plot multiple curves in Mathematica

Plot[{x,x^2,x^3},{x,0,1}]

they are given different colors. However, if I try to construct a list inside the Plot[] function,

Plot[Table[x^n, {n, 1, 3}], {x, 0, 1}]

this doesn't work and all the curves come out the same color. The standard advice (e.g. here, here and here), which works but which I don't fully understand, is to wrap the Table[] with an Evaluate[]:

Plot[Evaluate[Table[x^n, {n, 1, 3}]], {x, 0, 1}]

or equivalently

f[x_,n_]:=x^n;
Plot[Evaluate[Table[f[x,n], {n, 1, 3}]], {x, 0, 1}]

This work in this case, because f[x_]:=x^n is a simple function. However, suppose I have a complicated function g[y] which uses its argument y as a bound for an iterator:

g[y_] := Total[Table[1, {z, 1, Round[y + 1]}]]

Mathematica is not smart enough to recognize that this is equivalent to g[y_]:=Round[y]+1, and usually such a simplification will not be possible anyways. g[y] cannot be evaluated symbolically, because of the iterator, although it's still plenty fast when given a machine number. Then trying to plot various curves using a table constructed with g[y] without Evaluate[]

Plot[Table[g[x*n], {n, 1, 3}], {x, 0, 1}]

will make all the curves the same color. Adding Evaluate[]

Plot[Evaluate[Table[g[x*n], {n, 1, 3}]], {x, 0, 1}]

causes Mathematica to throw an error message about using a bad iterator. (Table::iterb: "Iterator {z,1,Round[1+x]} does not have appropriate bounds).

Why, exactly, is Evaluate[] necessary in the simple case? Is it true that Plot[] is interpreting the table as a multi-valued function? Why?

How can we achieve the same result in the complicated case where the technique fails?

$\endgroup$
0

6 Answers 6

30
$\begingroup$

Evaluate is necessary in this simple case because

Plot has attribute HoldAll, and evaluates f only after assigning specific numerical values to x

and because Plot determines automatic styles based on the unevaluated form of f. When you call Plot[Table[ ... ], ...], Plot looks at its first argument, Table[ ... ], without evaluating it and notes that it has a length of 1, and it constructs style specifications based on that information. You can override this behavior of Plot by applying Evaluate to its first argument.

A simple way to accomplish what you want is to redefine g so that it wraps its output with Hold:

g[y_] := Hold@Total[Table[1, {z, 1, Round[y + 1]}]]
Plot[Evaluate@Table[g[n*x], {n, 1, 3}], {x, 0, 1}]

This works because the evaluated form of the first argument to Plot is now

{Hold[Total[Table[1, {z, 1, Round[x + 1]}]]], Hold[Total[Table[1, {z, 1, Round[2 x + 1]}]]], Hold[Total[Table[1, {z, 1, Round[3 x + 1]}]]]}

which does have a length of 3, and it doesn't produce an error because each of these three forms is held unevaluated until they are inside an environment that has a value bound to x.

Note that this variation

g[y_] := Total[Table[1, {z, 1, Round[y + 1]}]]
Plot[Evaluate@Table[Hold@g[n*x], {n, 1, 3}], {x, 0, 1}]

does not work, because it prevents g from being evaluated at all - we want g to be expanded with different values of n.

Evaluate@Table[Hold@g[n*x], {n, 1, 3}]
(* == {Hold[g[n x]], Hold[g[n x]], Hold[g[n x]]} *)
$\endgroup$
5
  • $\begingroup$ Thanks very much! This is very close to a perfect answer, except that it requires me to redefine g[y]. Ideally we wouldn't need to do this because g might be a black box. We could just define h[y_]:=Hold[g[y]] and use that, although this is still slightly awkward. $\endgroup$ Commented Jul 23, 2012 at 20:47
  • $\begingroup$ @Jess It's a good point, and I don't think there's a way around it with this approach. I'm glad you found the explanation clear, though! $\endgroup$
    – DGrady
    Commented Jul 23, 2012 at 22:10
  • 5
    $\begingroup$ I didn't know that Plot would work with expressions inside Hold! Where is this documented? $\endgroup$
    – Mr.Wizard
    Commented Jul 24, 2012 at 10:06
  • 2
    $\begingroup$ @Mr.Wizard You know, that's a really good point - I found this through experimentation and didn't think about it too much, but it does mean that Plot must be using ReleaseHold at some point in the evaluation. And not all the plotting functions behave the same way: DiscretePlot[Evaluate@Table[g[n*x], {n, 1, 3}], {x, 0, 1, 0.1}] produces empty axes, for example. Just when you think you understand something... $\endgroup$
    – DGrady
    Commented Jul 24, 2012 at 18:28
  • $\begingroup$ I am switching this to the accepted answer almost 5 years after asking it because Simon's answer no longer works in Mathematica 11. $\endgroup$ Commented Apr 21, 2017 at 18:59
16
$\begingroup$

You could use the splitstyle function from this question :

splitstyle[styles__]:=Module[{st=Directive/@{styles}},{{Last[st=RotateLeft@st],#}}&];

g[y_]:=Total[Table[1,{z,1,Round[y+1]}]];

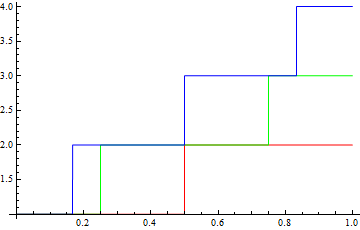
Plot[Table[g[x*n],{n,1,3}],{x,0,1},PlotStyle->splitstyle[Red,Green,Blue]]

enter image description here

Or to use the standard colours:

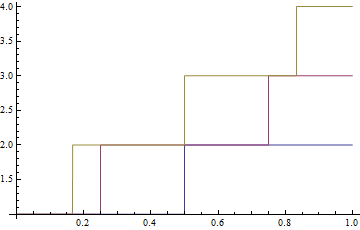
Plot[Table[g[x*n],{n,1,3}],{x,0,1},PlotStyle->splitstyle@@ColorData[1]/@{1,2,3}]

enter image description here

(Note: This does not work in Mathematica 11.)

$\endgroup$
8
  • $\begingroup$ Brilliant! I'm going to accept this because it doesn't require any modification of the primary argument of Plot[], just the inclusion of an option. (Of course, my decision has nothing to do with my spat with R.M about whether a fuller explanation of how Plot[] behaves would lead to a better answer... :) However, I'd like to point out to everyone that DGrady's answer is more compact, so if you don't mind modifying g[y] you should use his method. Thanks! $\endgroup$ Commented Jul 23, 2012 at 20:56
  • $\begingroup$ +1; that's a really clever trick. Didn't see why it could be so useful until I looked at the question you linked to. $\endgroup$
    – DGrady
    Commented Jul 23, 2012 at 22:08
  • 1
    $\begingroup$ @Simon: Is it explained anywhere exactly what is happening when you set the PlotStyle option to a function rather than a directive? This techniques doesn't seem to work for DiscretePlot. $\endgroup$ Commented Jul 24, 2012 at 11:33
  • $\begingroup$ @JessRiedel, I'm not sure if it's documented or not. I couldn't find it. Essentially Plot produces one or more Line primitives, and if you supply a function to PlotStyle it applies that function to each Line. For example you could use PlotStyle->(Point@@#&) to convert the lines to points. It appears that other plotting functions just ignore any PlotStyle which isn't a graphics directive. $\endgroup$ Commented Jul 24, 2012 at 18:49
  • 1
    $\begingroup$ Doesn't appear to work in Mathematica 11. $\endgroup$
    – Ruslan
    Commented Mar 23, 2017 at 7:05
8
$\begingroup$

Sadly the undocumented mechanism behind Simon's splitstyle no longer works in Mathematica 10.0 or 10.1. Post-processing(1),(2) remains an option as does use of ListPlot. While pure post-processing is possible, in a bid to make this answer unique I shall instead define styleSplitter as a function that extracts the PlotStyle option from an unevaluated Plot expression. If none is present the default for that plot type is taken from Options.

(This function can be viewed as a derivative of xslittlegrass's restylePlot2 that pulls style information from the Plot expression itself.)

SetAttributes[styleSplitter, HoldFirst]

styleSplitter[plot : h_[___, op : OptionsPattern[]]] :=
 MapAt[
   ListLinePlot[Cases[Normal @ #, Line[x__] :> x, -3]
   , PlotRange -> Full
   , PlotStyle -> OptionValue[h, {op}, PlotStyle] ][[1]] &
   , plot
   , 1
 ]

Test:

g[y_] := Total[Table[1, {z, 1, Round[y + 1]}]];

Plot[
  Table[g[x*n], {n, 1, 3}], {x, 0, 1},
  PlotStyle -> {Blue, Orange}
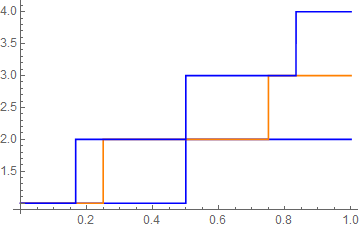
] // styleSplitter

enter image description here

Because styling is done by ListLinePlot itself automatic behaviors such as style cycling are preserved.

$\endgroup$
4
$\begingroup$

For completeness, I'm going to give a solution which is hacky, but slightly less hacky than the one described by R.M in a comment on the main post. Here it is:

Show[
    Plot[g[x*#], {x, 0, 1}, PlotRange -> {0, 5}, PlotStyle -> ColorData[1]@#]] &
     /@Table[n, {n, 1, 3}]
]

The advantage of this is that I don't need to modify g[y] and I also don't need to be quite as clever as Simon. There are significant disadvantages though. I had to add PlotRange -> {0, 5} because the default display range is now chosen by looking at just one of the curves. An ideal solution would retain the ability of Plot[] to consider all curves at the same time and automatically choose a good default plot range.

$\endgroup$
3
  • $\begingroup$ Unless I'm missing something, this doesn't address the issue of all the plots being in the same style? $\endgroup$ Commented Jul 24, 2012 at 18:48
  • $\begingroup$ Oh, whoops. I forgot the important but, where you use the index n to pull the style out of a list of directives. Thanks for spotting that. $\endgroup$ Commented Jul 24, 2012 at 19:49
  • $\begingroup$ It's a bit cleaner to use Range[1,3] instead of Table[n, {n, 1, 3}]. $\endgroup$
    – Ruslan
    Commented Sep 10, 2016 at 12:46
3
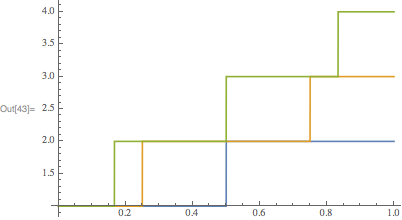
$\begingroup$

I don't think changing g to evaluate to a Hold object (as in the accepted answer) is very convenient, and it relies on the undocumented (perhaps unintended) behavior of Plot with Hold expressions. Instead, I would try one of the following approaches.

Argument restriction

Force g to only evaluate when given a numeric argument:

Clear[g]
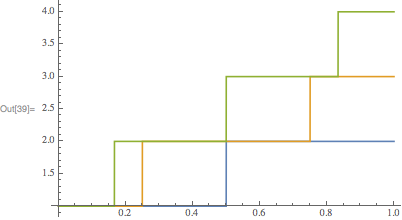
g[y_?NumericQ] := Total[Table[1, {z, 1, Round[y + 1]}]]

Plot[Evaluate @ Table[g[n x], {n, 3}], {x, 0, 1}]

enter image description here

Inactive

Inactivate both Plot and g, construct the desired plot expression, then Activate:

Clear[g]
g[y_] := Total[Table[1, {z, 1, Round[y + 1]}]]

Activate @ Inactive[Plot][Table[Inactive[g][n x], {n, 3}], {x, 0, 1}]

enter image description here

Another variation of this idea is:

Activate @ Inactivate[Plot[Table[g[n x], {n, 3}], {x, 0, 1}], Plot | g]
$\endgroup$
2
$\begingroup$

In this particular case, the problem is with the definition of g

Clear[g]

g[y_] := Total@Table[1, {z, 1, Round[y + 1]}]

Note, for example, that g[y] /. y -> 3.5 is not equivalent to g[3.5]

g[y] /. y -> 3.5

enter image description here

g[3.5]

(* 4 *)

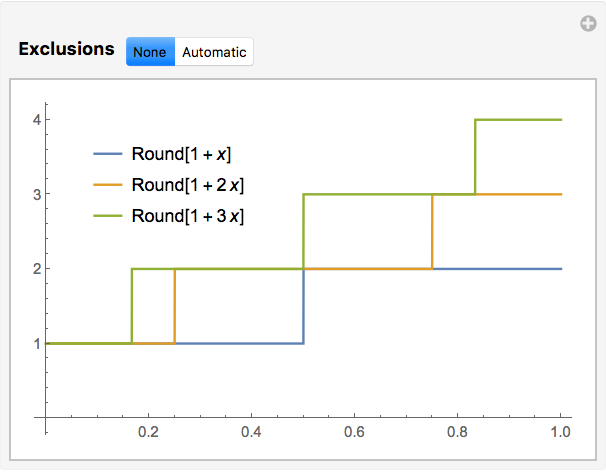
Carl Woll showed a solution using ?NumericQ to avoid evaluation unless the argument is numeric. However, for this case since Total@Table[ ... ] is equivalent to Sum[ ... ], you could also redefine g as

Clear[g]

g[y_] := Sum[1, {z, 1, Round[y + 1]}]

Attributes[Sum]

(* {HoldAll, Protected, ReadProtected} *)

Since Sum has attribute HoldAll, now

(g[y] /. y -> 3.5) == g[3.5]

(* True *)

Manipulate[
 Plot[
  Evaluate@Table[g[x*n], {n, 1, 3}],
  {x, 0, 1}, PlotLegends -> Placed["Expressions", 0.25 {1, 3}],
  AxesOrigin -> {0, 0},
  Exclusions -> exc],
 {{exc, None, Style["Exclusions", 12, Bold]}, {None, Automatic}}]

enter image description here

$\endgroup$

Your Answer

By clicking “Post Your Answer”, you agree to our terms of service and acknowledge you have read our privacy policy.

Not the answer you're looking for? Browse other questions tagged or ask your own question.