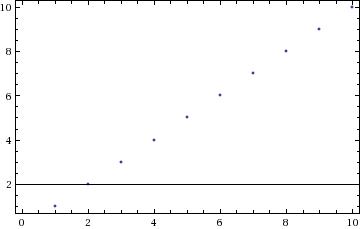
Why is Mathematica plotting a horizontal line at $y=2$ in the following example:
ListPlot[Table[i,{i,1,10}],Frame->True,GridLines->None]

How to get rid of this line?
TL;DR
What you see is the x axis, it is not the GridLine so Axes->False is the fix.
Or rather it is what you have missed because by default Axes->True and it was just a coincidence that it was observed only for V7 users.
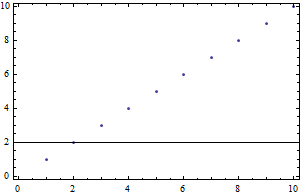
The reason why others do not see this in newer versions is only this that the Automatic AxesOrigin is generated in different place.
To reproduce this behaviour in V9 other simply need to add this:
ListPlot[Table[i, {i, 1, 10}], Frame -> True, GridLines -> None,
                               AxesOrigin -> {0, 2}]

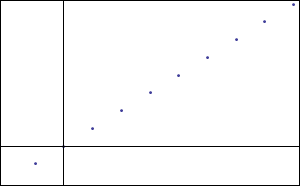
$y$ axis is overlayed by Frame so it is "not" visible.
It could be quite confusing because with Frame->True you can't put Ticks on axes so single line do not look like and axis at all.
Even if one set FrameTicks->None... interesting, but it is different issue so let's not talk about it here.
ListPlot[Table[i, {i, 1, 10}], Frame -> True, GridLines -> None,
                               FrameTicks -> None, AxesOrigin -> {2, 2},
                               Ticks -> True]

Mathematica 7but it doesn't in newer versions. $\endgroup$Axes -> {False, True}orAxesOrigin -> {0, 0}have the desired effect (I am using Mma 7)? $\endgroup$Axes -> Falsesince I doubt you want the y-axis. However, there are plots I've made where both frame and axes are used. $\endgroup$