Edit
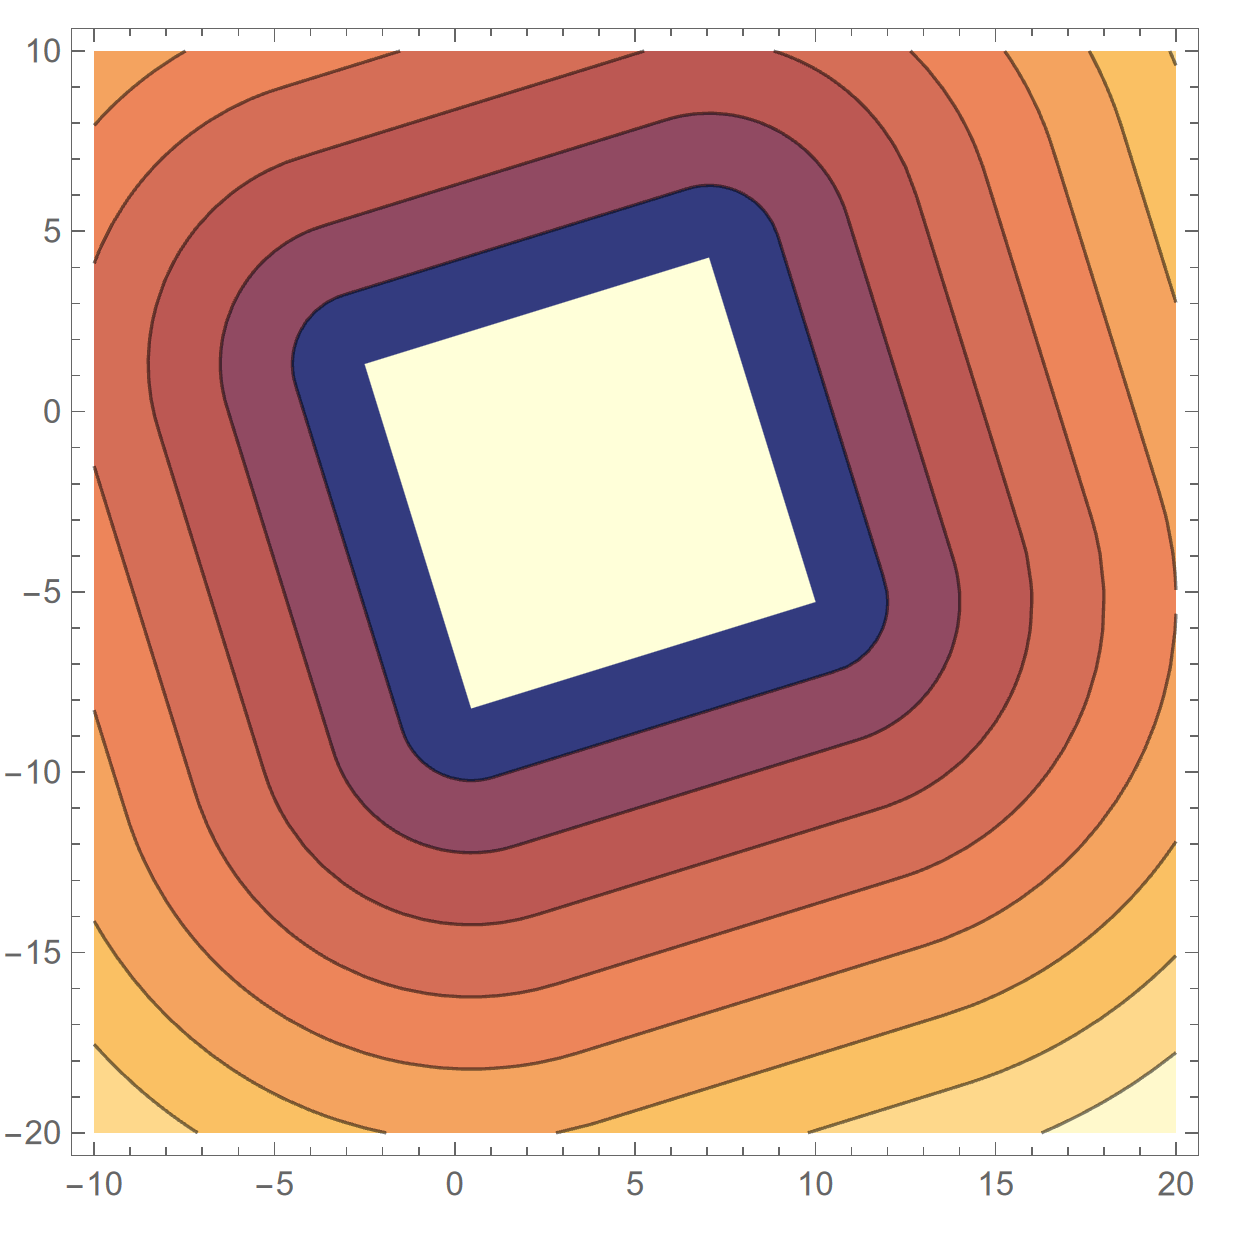
Finally we found that add the center {0, 0} in the Rotate do the job.
Clear["Global`*"];
L = 10;
square =
  Rotate[Translate[Rectangle[-{L, L}/2, {L, L}/2], {3, -3}],
   0.3, {0, 0} (*add here *)];

dist = RegionDistance[square];

Show[ContourPlot[dist[{x, y}], {x, -L, 2 L}, {y, -2 L, L},
  Exclusions -> None], Graphics[{LightYellow, square}]]
Edit
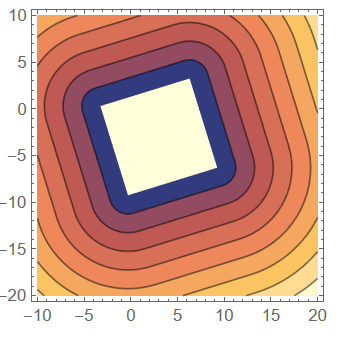
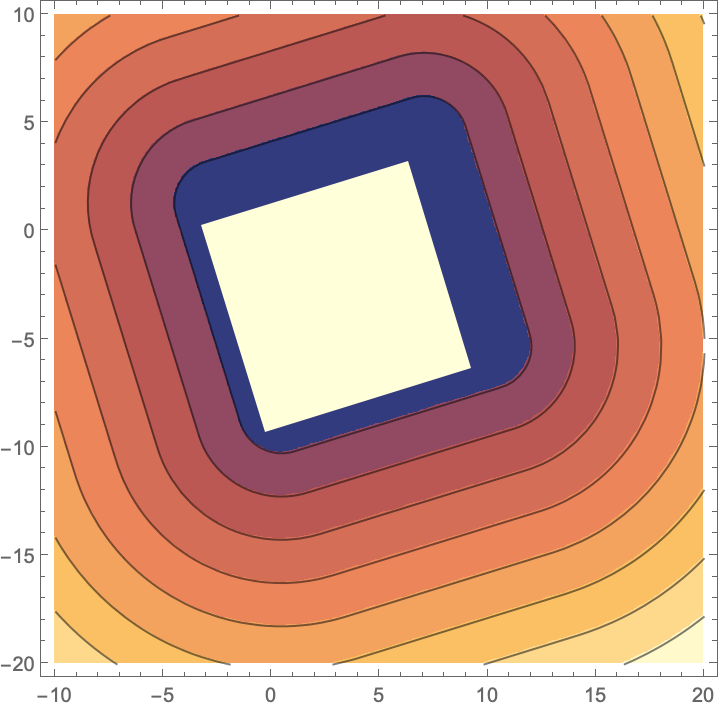
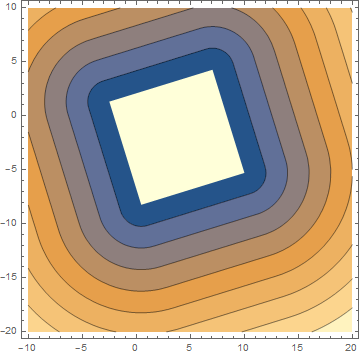
- Compare with the five results, I confirm that upto 14.1 version, it is recommend that not use the
Rotate as the last transformation.
Clear["Global`*"];
L = 10;
rectangle = Rectangle[-{L, L}/2, {L, L}/2];
square = Rotate[Translate[rectangle, {3, -3}], 0.3];
square2 =
  GeometricTransformation[rectangle,
   RotationTransform[.3]@*TranslationTransform[{3, -3}]];
square3 =
  GeometricTransformation[rectangle,
   TranslationTransform[RotationMatrix[.3] . {3, -3}]@*
    RotationTransform[.3]];
square4 =
  TransformedRegion[rectangle,
   RotationTransform[.3]@*TranslationTransform[{3, -3}]];
square5 =
  TransformedRegion[rectangle,
   RotationTransform[.3] . TranslationTransform[{3, -3}]];
dist = RegionDistance[square];
dist2 = RegionDistance[square2];
dist3 = RegionDistance[square3];
dist4 = RegionDistance[square4];
dist5 = RegionDistance[square5];
{ContourPlot[dist[{x, y}], {x, -L, 2 L}, {y, -2 L, L},
  Exclusions -> None, Epilog -> {LightYellow, square}],
 ContourPlot[dist2[{x, y}], {x, -L, 2 L}, {y, -2 L, L},
  Exclusions -> None, Epilog -> {LightYellow, square2}],
 ContourPlot[dist3[{x, y}], {x, -L, 2 L}, {y, -2 L, L},
  Exclusions -> None, Epilog -> {LightYellow, square3}],
 ContourPlot[dist4[{x, y}], {x, -L, 2 L}, {y, -2 L, L},
  Exclusions -> None, Epilog -> {LightYellow, square4}],
 ContourPlot[dist5[{x, y}], {x, -L, 2 L}, {y, -2 L, L},
  Exclusions -> None, Epilog -> {LightYellow, square5}]}

Original
Clear[square];
square =
  Translate[Rotate[Rectangle[-{L, L}/2, {L, L}/2], .3], {3, -3}];
RegionQ[square]



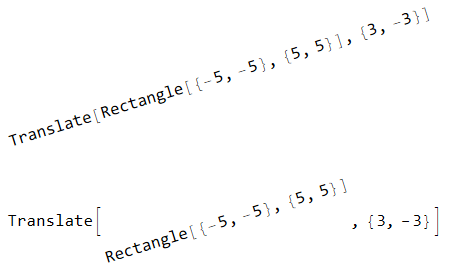
rotatenot always get a proper region ( for later version maybe fully support all the graphics object be an region) $\endgroup$