2
$\begingroup$

I'm trying to demonstrate the aliasing effect using sound, that is, when the sample rate is fixed and the sound frequency is increased, we would hear the sound pitch go down when we pass the Nyquist frequency.

Here is what I tried so far:

Manipulate[
 EmitSound[
  Play[Sin[ω* t], {t, 0, 0.2}, SampleRate -> 900]], {ω, 200, 6000, 10}]

Manipulate[
 EmitSound[
  Play[Sin[ω* t], {t, 0, 0.2}, SampleRate -> 8000]], {ω,200, 6000, 10}]

Question: The sound is a little bit lag to the slider. Is it possible to create a more responsive one like this

Manipulate[EmitSound[Sound[SoundNote[n, 3]]], {n, 1, 10, 1}]
$\endgroup$
1
  • $\begingroup$ This question is very closely related, if not a duplicate (re: the choppy and disconnected notes with Play). There's also this answer, although I have not tried it. $\endgroup$
    – rm -rf
    Commented Aug 21, 2013 at 18:01

1 Answer 1

7
$\begingroup$

Here's one way to explore aliasing in audio using a "chirp" signal (thus avoiding the problems of real-time sound generation). A chirp is a sinusoid-like signal with frequency that constantly increases. Using the formula from the Wikipedia page, the chirp can be generated using

chirp[t_] := Sin[2 Pi (f0 t + (k/2) t^2)];

which is a sinusoid-like signal with instantaneous frequency f0 + kt. Hence the frequency increases as time progresses. If the sampling was done very quickly, then this is what we would hear. However, if the sampling frequency is low (such as 1000 Hz), the frequency will increase only up to the Nyquist frequency (in this case 1000/2 = 500 Hz.).

Select some nominal values and create a sampled version of the signal (using Table).

f0 = 200; k = 100; 
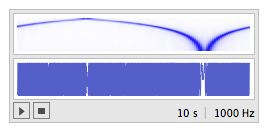
Sound[SampledSoundList[Table[chirp[t], {t, 0, 10, 0.001}], 1000]]

chirp

With these values, the "instantaneous frequency" is 200+100*t Hz. If you press the play button, you can hear the sound starting at 200 Hz and increasing. When it gets to the Nyquist frequency 500 (at about 3 seconds in), it starts to descend. The small upper figure shows (a rough version of) the spectrogram (a plot with time on the horizontal axis and frequency on the vertical axis). This agrees quite nicely with what you hear -- the sine wave sweeping up, then down, then up again over the course of 10 seconds.

$\endgroup$

Your Answer

By clicking “Post Your Answer”, you agree to our terms of service and acknowledge you have read our privacy policy.

Not the answer you're looking for? Browse other questions tagged or ask your own question.