added link to sound
Source Link

Here's one way to explore aliasing in audio using a "chirp" signal (thus avoiding the problems of real-time sound generation). A chirp is a sinusoid-like signal with frequency that constantly increases. Using the formula from the Wikipedia page, the chirp can be generated using

chirp[t_] := Sin[2 Pi (f0 t + (k/2) t^2)];

which is a sinusoid-like signal with instantaneous frequency f0 + kt. Hence the frequency increases as time progresses. If the sampling was done very quickly, then this is what we would hear. However, if the sampling frequency is low (such as 1000 Hz), the frequency will increase only up to the Nyquist frequency (in this case 1000/2 = 500 Hz.).

Select some nominal values and create a sampled version of the signal (using Table).

f0 = 200; k = 100; 
Sound[SampledSoundList[Table[chirp[t], {t, 0, 10, 0.001}], 1000]]

enter image description herechirp

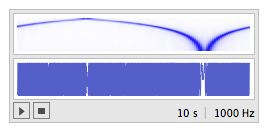
With these values, the "instantaneous frequency" is 200+100*t Hz. If you press the play button, you can hear the sound starting at 200 Hz and increasing. When it gets to the Nyquist frequency 500 (at about 3 seconds in), it starts to descend. The small upper figure shows (a rough version of) the spectrogram (a plot with time on the horizontal axis and frequency on the vertical axis). This agrees quite nicely with what you hear -- the sine wave sweeping up, then down, then up again over the course of 10 seconds.

Here's one way to explore aliasing in audio using a "chirp" signal (thus avoiding the problems of real-time sound generation). A chirp is a sinusoid-like signal with frequency that constantly increases. Using the formula from the Wikipedia page, the chirp can be generated using

chirp[t_] := Sin[2 Pi (f0 t + (k/2) t^2)];

which is a sinusoid-like signal with instantaneous frequency f0 + kt. Hence the frequency increases as time progresses. If the sampling was done very quickly, then this is what we would hear. However, if the sampling frequency is low (such as 1000 Hz), the frequency will increase only up to the Nyquist frequency (in this case 1000/2 = 500 Hz.).

Select some nominal values and create a sampled version of the signal (using Table).

f0 = 200; k = 100; 
Sound[SampledSoundList[Table[chirp[t], {t, 0, 10, 0.001}], 1000]]

enter image description here

With these values, the "instantaneous frequency" is 200+100*t Hz. If you press the play button, you can hear the sound starting at 200 Hz and increasing. When it gets to the Nyquist frequency 500 (at about 3 seconds in), it starts to descend. The small upper figure shows (a rough version of) the spectrogram (a plot with time on the horizontal axis and frequency on the vertical axis). This agrees quite nicely with what you hear -- the sine wave sweeping up, then down, then up again over the course of 10 seconds.

Here's one way to explore aliasing in audio using a "chirp" signal (thus avoiding the problems of real-time sound generation). A chirp is a sinusoid-like signal with frequency that constantly increases. Using the formula from the Wikipedia page, the chirp can be generated using

chirp[t_] := Sin[2 Pi (f0 t + (k/2) t^2)];

which is a sinusoid-like signal with instantaneous frequency f0 + kt. Hence the frequency increases as time progresses. If the sampling was done very quickly, then this is what we would hear. However, if the sampling frequency is low (such as 1000 Hz), the frequency will increase only up to the Nyquist frequency (in this case 1000/2 = 500 Hz.).

Select some nominal values and create a sampled version of the signal (using Table).

f0 = 200; k = 100; 
Sound[SampledSoundList[Table[chirp[t], {t, 0, 10, 0.001}], 1000]]

chirp

With these values, the "instantaneous frequency" is 200+100*t Hz. If you press the play button, you can hear the sound starting at 200 Hz and increasing. When it gets to the Nyquist frequency 500 (at about 3 seconds in), it starts to descend. The small upper figure shows (a rough version of) the spectrogram (a plot with time on the horizontal axis and frequency on the vertical axis). This agrees quite nicely with what you hear -- the sine wave sweeping up, then down, then up again over the course of 10 seconds.

added 164 characters in body
Source Link
bill s
  • 69.7k
  • 4
  • 103
  • 198

Here's one way to explore aliasing in audio using a "chirp" signal (thus avoiding the problems of real-time sound generation). A chirp is a sinusoid-like signal with frequency that constantly increases. Using the formula from the Wikipedia page, the chirp can be generated using

chirp[t_] := Sin[2 Pi (f0 t + (k/2) t^2)];

which is a sinusoid-like signal with instantaneous frequency f0 + kt. Hence the frequency increases as time progresses. If the sampling was done very quickly, then this is what we would hear. However, if the sampling frequency is low (such as 1000 Hz), the frequency will increase only up to the Nyquist frequency (in this case 1000/2 = 500 Hz.).

Select some nominal values and create a sampled version of the signal (using Table).

f0 = 200; k = 100; 
Sound[SampledSoundList[Table[chirp[t], {t, 0, 10, 0.001}], 1000]]

enter image description here

With these values, the "instantaneous frequency" is 200+100*t Hz. If you press the play button, you can hear the sound starting at 200 Hz and increasing. When it gets to the Nyquist frequency 500 (at about 3 seconds in), it starts to descend. The small upper figure shows (a rough version of) the spectrum, whichspectrogram (a plot with time on the horizontal axis and frequency on the vertical axis). This agrees quite nicely with what you hear -- the sine wave sweeping up, then down, then up again over the course of 10 seconds.

Here's one way to explore aliasing in audio using a "chirp" signal (thus avoiding the problems of real-time sound generation). A chirp is a sinusoid-like signal with frequency that constantly increases. Using the formula from the Wikipedia page, the chirp can be generated using

chirp[t_] := Sin[2 Pi (f0 t + (k/2) t^2)];

which is a sinusoid-like signal with instantaneous frequency f0 + kt. Hence the frequency increases as time progresses. If the sampling was done very quickly, then this is what we would hear. However, if the sampling frequency is low (such as 1000 Hz), the frequency will increase only up to the Nyquist frequency (in this case 1000/2 = 500 Hz.).

Select some nominal values and create a sampled version of the signal (using Table).

f0 = 200; k = 100; 
Sound[SampledSoundList[Table[chirp[t], {t, 0, 10, 0.001}], 1000]]

enter image description here

With these values, the "instantaneous frequency" is 200+100*t Hz. If you press the play button, you can hear the sound starting at 200 Hz and increasing. When it gets to the Nyquist frequency 500 (at about 3 seconds in), it starts to descend. The small upper figure shows (a rough version of) the spectrum, which agrees quite nicely with what you hear.

Here's one way to explore aliasing in audio using a "chirp" signal (thus avoiding the problems of real-time sound generation). A chirp is a sinusoid-like signal with frequency that constantly increases. Using the formula from the Wikipedia page, the chirp can be generated using

chirp[t_] := Sin[2 Pi (f0 t + (k/2) t^2)];

which is a sinusoid-like signal with instantaneous frequency f0 + kt. Hence the frequency increases as time progresses. If the sampling was done very quickly, then this is what we would hear. However, if the sampling frequency is low (such as 1000 Hz), the frequency will increase only up to the Nyquist frequency (in this case 1000/2 = 500 Hz.).

Select some nominal values and create a sampled version of the signal (using Table).

f0 = 200; k = 100; 
Sound[SampledSoundList[Table[chirp[t], {t, 0, 10, 0.001}], 1000]]

enter image description here

With these values, the "instantaneous frequency" is 200+100*t Hz. If you press the play button, you can hear the sound starting at 200 Hz and increasing. When it gets to the Nyquist frequency 500 (at about 3 seconds in), it starts to descend. The small upper figure shows (a rough version of) the spectrogram (a plot with time on the horizontal axis and frequency on the vertical axis). This agrees quite nicely with what you hear -- the sine wave sweeping up, then down, then up again over the course of 10 seconds.

deleted 31 characters in body
Source Link
bill s
  • 69.7k
  • 4
  • 103
  • 198

Here's one way to explore aliasing in audio using a "chirp" signal (thus avoiding the problems of real-time sound generation). A chirp is a sinusoid-like signal with frequency that constantly increases. Using the formula from the Wikipedia page, the chirp can be generated using

chirp[t_] := Sin[2 Pi (f0 t + (k/2) t^2)];

which is a sinusoid-like signal with instantaneous frequency f0 + kt. Hence the frequency increases as time progresses. If the sampling was done very quickly, then this is what we would hear. However, if we set the sampling frequency to somethingis low (such as 1000 times per secondHz), the frequency will increase only up to the Nyquist frequency (in this case 1000/2 = 500 Hz.).

Select some nominal values and create a sampled version of the signal (using Table).

f0 = 200; k = 100; 
Sound[SampledSoundList[Table[chirp[t], {t, 0, 10, 0.001}], 1000]]

enter image description here

With these values, the "instantaneous frequency" is 200+100*t Hz. If you press the play button, you can hear the sound starting at 200 Hz and increasing. When it gets to the Nyquist frequency 500 (at about 3 seconds in), it starts to descend. The small upper figure shows (a rough version of) the spectrum, which agrees quite nicely with what you hear.

Here's one way to explore aliasing in audio using a "chirp" signal (thus avoiding the problems of real-time sound generation). A chirp is a sinusoid-like signal with frequency that constantly increases. Using the formula from the Wikipedia page, the chirp can be generated using

chirp[t_] := Sin[2 Pi (f0 t + (k/2) t^2)];

which is a sinusoid-like signal with instantaneous frequency f0 + kt. Hence the frequency increases as time progresses. If the sampling was done very quickly, then this is what we would hear. However, if we set the sampling frequency to something low (such as 1000 times per second), the frequency will increase only up to the Nyquist frequency (in this case 1000/2 = 500 Hz.).

Select some nominal values and create a sampled version of the signal (using Table).

f0 = 200; k = 100; 
Sound[SampledSoundList[Table[chirp[t], {t, 0, 10, 0.001}], 1000]]

enter image description here

With these values, the "instantaneous frequency" is 200+100*t Hz. If you press the play button, you can hear the sound starting at 200 Hz and increasing. When it gets to the Nyquist frequency 500 (at about 3 seconds in), it starts to descend. The small upper figure shows (a rough version of) the spectrum, which agrees quite nicely with what you hear.

Here's one way to explore aliasing in audio using a "chirp" signal (thus avoiding the problems of real-time sound generation). A chirp is a sinusoid-like signal with frequency that constantly increases. Using the formula from the Wikipedia page, the chirp can be generated using

chirp[t_] := Sin[2 Pi (f0 t + (k/2) t^2)];

which is a sinusoid-like signal with instantaneous frequency f0 + kt. Hence the frequency increases as time progresses. If the sampling was done very quickly, then this is what we would hear. However, if the sampling frequency is low (such as 1000 Hz), the frequency will increase only up to the Nyquist frequency (in this case 1000/2 = 500 Hz.).

Select some nominal values and create a sampled version of the signal (using Table).

f0 = 200; k = 100; 
Sound[SampledSoundList[Table[chirp[t], {t, 0, 10, 0.001}], 1000]]

enter image description here

With these values, the "instantaneous frequency" is 200+100*t Hz. If you press the play button, you can hear the sound starting at 200 Hz and increasing. When it gets to the Nyquist frequency 500 (at about 3 seconds in), it starts to descend. The small upper figure shows (a rough version of) the spectrum, which agrees quite nicely with what you hear.

added 357 characters in body
Source Link
bill s
  • 69.7k
  • 4
  • 103
  • 198
Loading
added 4 characters in body
Source Link
bill s
  • 69.7k
  • 4
  • 103
  • 198
Loading
added 4 characters in body
Source Link
bill s
  • 69.7k
  • 4
  • 103
  • 198
Loading
Source Link
bill s
  • 69.7k
  • 4
  • 103
  • 198
Loading