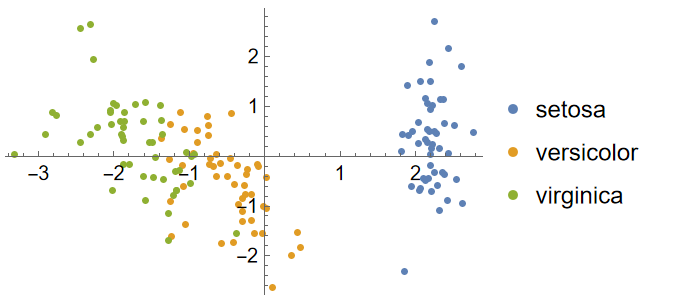
In the documentation for DimensionReduce and functions related to it, there is an example in the Applications section where the Fisher iris dataset from ExampleData is reduced. The data is described as
The data set consists of 50 samples from each of three species of iris flowers (setosa, versicolor and virginica). Four features were measured from each flower the length and the width of the sepal and petal.
And the 4-dimensional data is reduced to 2 dimensions, as displayed by the final plot:
My question is, what if you did not have the data labeled by flower and only had the measurements? Certainly you can see the setosa data is set apart in the reduced space. But what does this actually mean? How can we take the reduction, or the corresponding DimensionReduction function, and relate that cluster back to the original measurements? In other words, how do we determine the characteristics of the measurements that cause the setosa data to "cluster" around the first reduced variable value near 2?
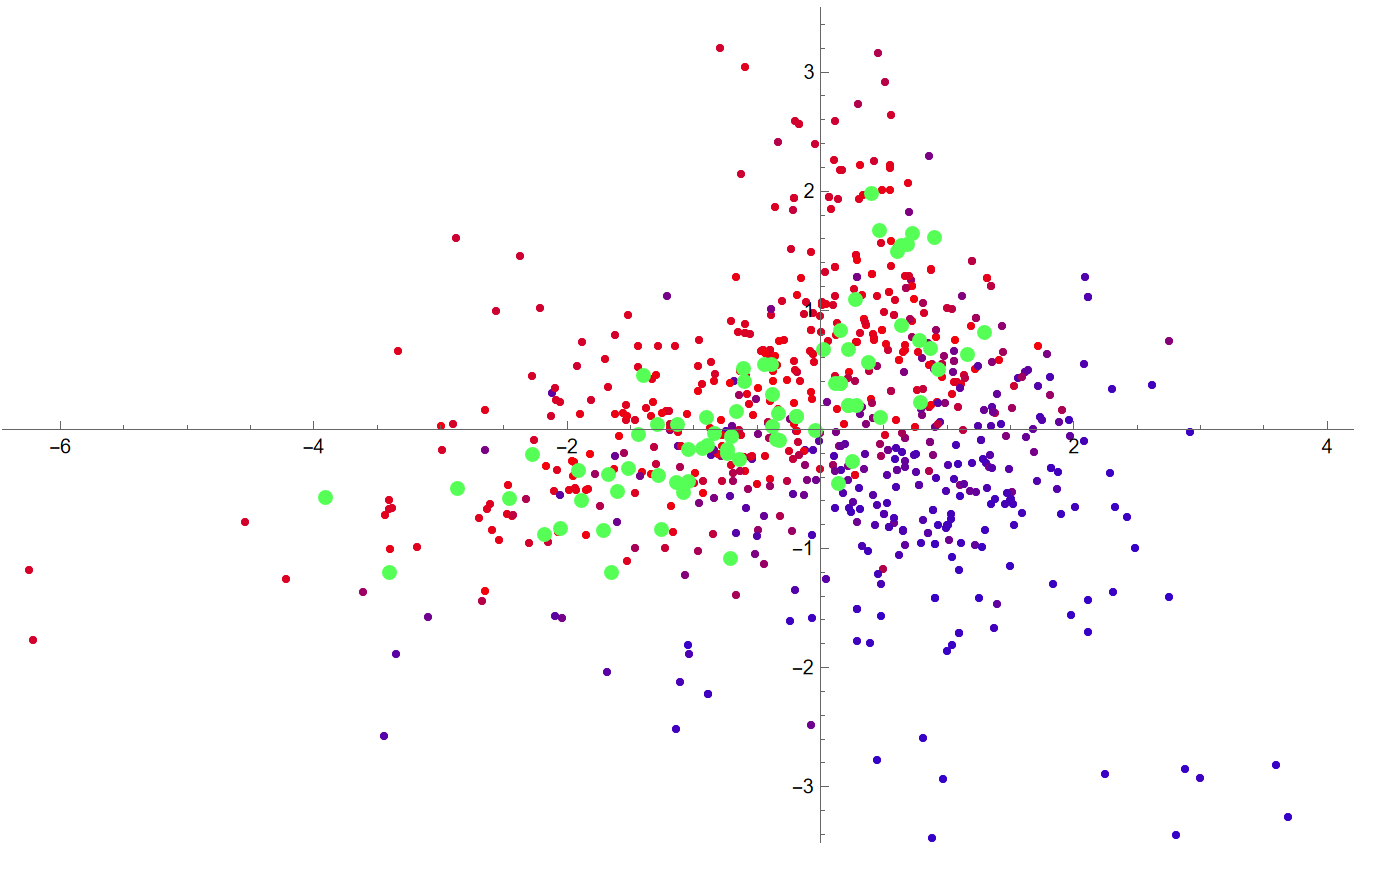
I'll include my actual need here in case I am engaging in an XY problem. I have a model that takes in 6 parameters and outputs one value. I have previously determined many parameter sets of interest, and if I take the 6-dimensional parameter sets and use DimensionReduce to reduce to 2 dimensions, I get the following plot
where the red-blue color coding relates to the model output each parameter set gives, and the green points are the parameter sets I am particularly interested in. I want to know if using DimensionReduce can use the fact that the green points seem to follow a linear trend in the reduced space to give me some sort of relationship between those parameter sets. e.g., does the direction of that line correspond to a direction / curve in the 6-dimensional parameter space? Is there a way to pull out that information?


PrincipalComponentAnalysisin MMA) may give you some of the insight you seek. It is an unsupervised technique, so it does not require that the input include category labels. $\endgroup$