3
$\begingroup$

I want to arrange two 3d-plots, for example

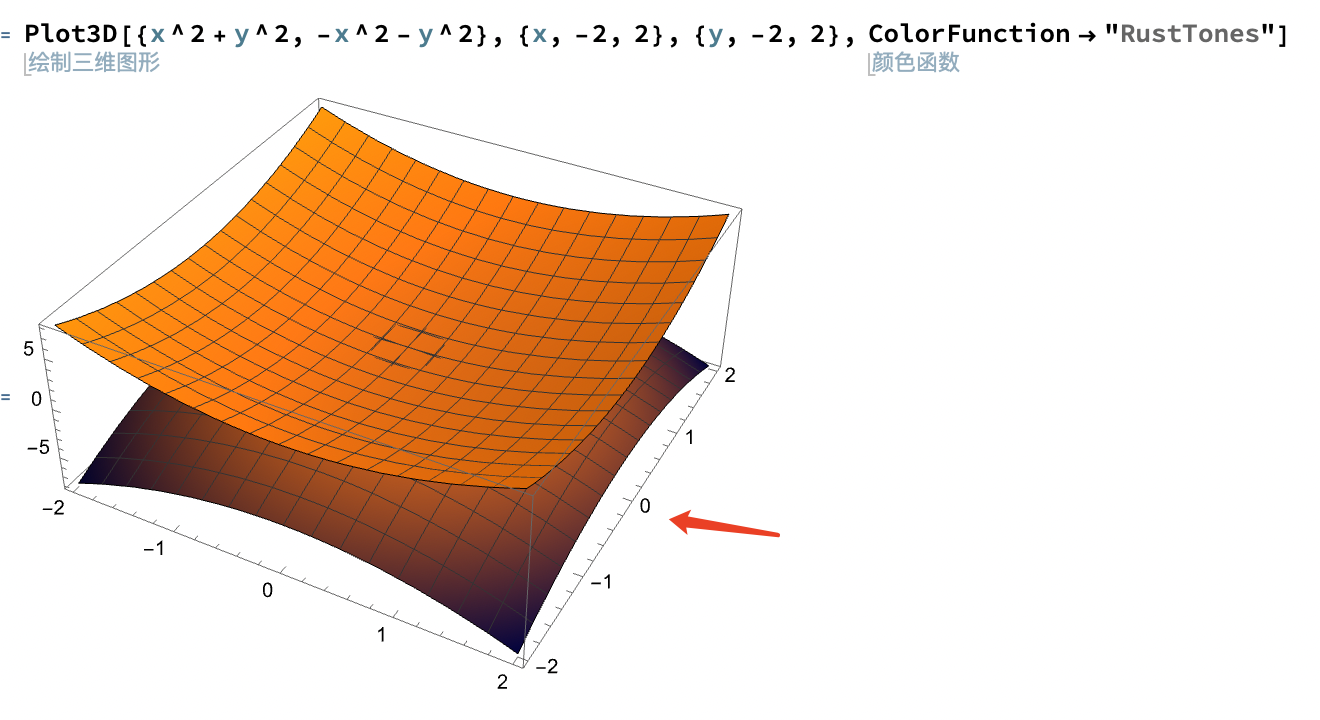
Plot3D[{x^2 + y^2, -x^2 - y^2}, {x, -2, 2}, {y, -2, 2}, 
 ColorFunction -> "RustTones"]

which gives enter image description here

where the position of y-axis is marked by the red arrow. However, when I arrage such two 3d-plots,

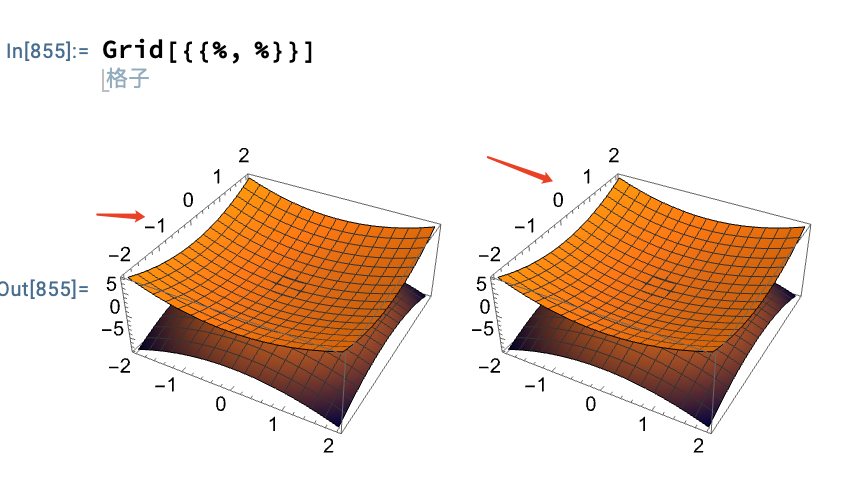
Grid[{{%, %}}]

enter image description here

However, y-axis moves to the top. Why so? How to keep y-axis at the orignal position?

Thank you!

$\endgroup$

1 Answer 1

4
$\begingroup$
plot =
  Plot3D[{x^2 + y^2, -x^2 - y^2}, {x, -2, 2}, {y, -2, 2},
   ColorFunction -> "RustTones"];

Using GraphicsRow

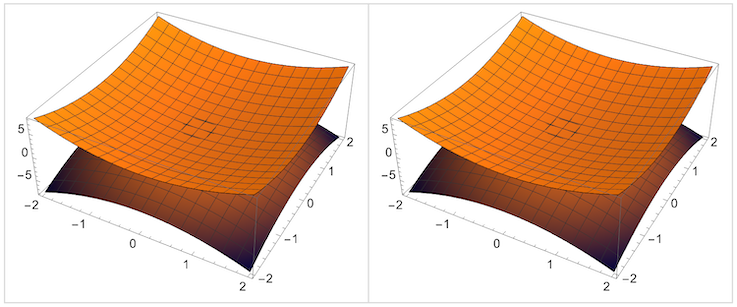
GraphicsRow[{plot, plot}, Dividers -> All, FrameStyle -> LightGray]

enter image description here

Using GraphicsGrid

GraphicsGrid[{{plot, plot}}, Dividers -> All, FrameStyle -> LightGray]

output like above

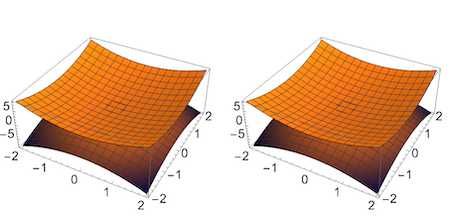
If you have to use Grid the problem disappears by specifying the AxesEdge - option

plot =
  Plot3D[{x^2 + y^2, -x^2 - y^2}, {x, -2, 2}, {y, -2, 2},
   AxesEdge -> {{-1, -1}, {1, -1}, {-1, -1}},
   ColorFunction -> "RustTones"];

Grid[{{plot, plot}}]

enter image description here

$\endgroup$

Your Answer

By clicking “Post Your Answer”, you agree to our terms of service and acknowledge you have read our privacy policy.

Not the answer you're looking for? Browse other questions tagged or ask your own question.