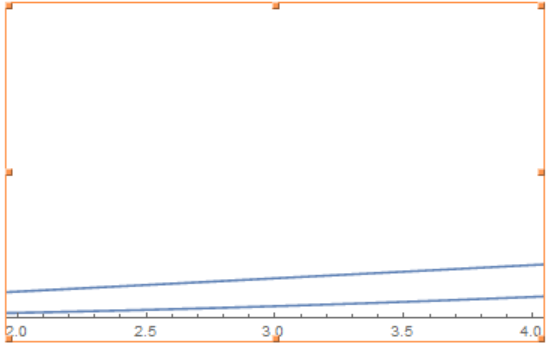
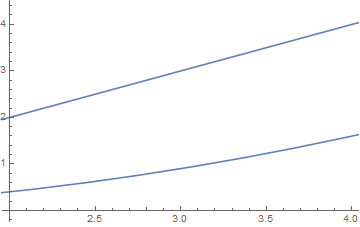
Let's say I have two plots I want to Show on top of each other. However, I am only interested in a certain sub-region:
myplots = {Plot[x, {x, 0, 15}], Plot[1/10 x^2, {x, 0, 15}]};
Show[myplots, PlotRange -> {{2, 4}, All}]
I don't like two things about this plot:
1) The y axis and numbers are not displayed.
2) The y axis scale is not adjusted to display only the relevant region where the curves can be seen.
How to fix these issues?
PS:
Note that I do want to display the entire region in myplots and then focus to sub-region in Show, since the plots I actually am interested in looking at take much longer to render. So having pre-rendered them completely and then selecting sub-regions in Show is a feature I'd like to keep.


AxesOrigin -> Automaticor usingFrameTicksand related options. $\endgroup$