In the original question posted on 23-04-2024, there was a typo in the numbers given in the nested lists: a superscript symbol (^) was missing in the nested list, i.e, it should have been $9.62948*10^{-5}$, not $9.62948*10 (-05)$, which was giving an answer of -481.474.
Apologies for that.
When this is included and modified the pgm based on the comments received, I could be able to solve the problem for my wrong nested list of numbers. However, for the sake of transparency the original question with is moved to the end. But since the question still is about "two variables and 6 or more Parameters", I would request peoples help.
I have some set of values, which I need to fit into an equation of the form
$$y=(A1*e^{(-A2*x1^2)}*e^{(-A3*x2^2)}) + (B1*e^{(-B2*x1^2)}*e^{(-B3*x2^2)})+...+(F1*e^{(-F2*x1^2)}*e^{(-F3*x2^2)})$$
Documentation of NonlinearModelFit tells that we can fit a model of more than one variable.
In order to make it simpler, let us take first two terms only. Let me construct a known list from a known equation and see whether, using NonlinearModelFit, whether we are getting the same equation or not.
Let that equation be
$$ (1.6509*10^{-8}*e^{-4.88874*10^{-9}*x1^2}*e^{-2.96118*10^{-9}*x2^2})+(2.61174*10^{-13}*e^{-4.15562*10^{-12}*x1^2}*
e^{-3.03577*10^{-12}*x2^2}) $$
from which I will get the following nested list:
listofnumbers={{18652, 14392, 1.632216118192*10^(-09)}, {30562, 26148,
  2.292391805703*10^(-11)}, {51366, 53694,
  2.560830320322*10^(-13)}, {55949, 74432,
  2.534990350929*10^(-13)}, {66834, 88051,
  2.504071860100*10^(-13)}, {74234, 93887,
  2.485208936764*10^(-13)}, {76503, 497174,
  1.203588333580*10^(-13)}, {85874, 966570,
  1.485521219415*10^(-14)}, {99885, 1107888,
  6.034989113385*10^(-15)}, {130916, 1316018,
  1.266558490101*10^(-15)}}
Here the first two in a nested list are the values of $x1$ and $x2$ and the third one is the value of $y$. Now I am trying to fit with the command:
NonlinearModelFit[
  listofnumbers, (A1*Exp[A2*x1^2]*Exp[A3*x2^2]) + (B1*Exp[B2*x1^2]*
     Exp[B3*x2^2]) , {A1, A2, A3, B1, B2, B3}, {x1, x2},
  MaxIterations -> 500000] // Normal
This give the error:
NonlinearModelFit::sszero: The step size in the search has become less than the tolerance prescribed by the PrecisionGoal option, but the gradient is larger than the tolerance specified by the AccuracyGoal option. There is a possibility that the method has stalled at a point that is not a local minimum.
Could anyone please help me to get the correct equation?
Thanks in advance.
Using Mathematica 11.0 in Windows 11 laptop
Original question
Let that equation be $$(1.65*e^{(-4.89*x1^2)}*e^{(-2.96*x2^2)})+(2.93*e^{(-4.01*x1^2)}*e^{(-1.28*x2^2)})$$, from which I will get the following nested list:
listofnumbers = {{1.608580798, 0.048747563,
    9.62948*10 (-05)}, {1.691986229, 0.252963119,
    2.90385*10 (-05)}, {1.744420751, 0.279857186,
    1.37519*10 (-05)}, {1.921216164, 0.365670381,
    9.37522*10 (-07)}, {1.926043018, 0.474276385,
    7.72263*10 (-07)}, {2.113641579, 0.608471519,
    3.04376*10 (-08)}, {2.142115855, 0.745279726,
    1.47416*10 (-08)}, {2.1527092, 0.771491653,
    1.16691*10 (-08)}, {2.155881396, 0.845132544,
    9.47909*10 (-09)}, {2.19463771, 1.284861887, 1.45028*10 (-09)}};
Here the first two in a nested list are the values of $x1$ and $x2$ and the third one is the value of $y$. Now I am trying to fit with the command:
NonlinearModelFit[listofnumbers, (A1*Exp[A2*x1^2]*Exp[A3*x2^2]) + (B1*
    Exp[B2*x1^2]*Exp[B3*x2^2]) , {A1, A2, A3, B1, B2, B3}, {x1, x2}]
which give the following equation:
As you can see, the expression that Mathematica returns back is not the one that we used to make $y$. Let us see what happens if we give the starting values to parameters:
NonlinearModelFit[listofnumbers, (A1*Exp[A2*x1^2]*Exp[A3*x2^2]) + (B1*
    Exp[B2*x1^2]*Exp[B3*x2^2]) , {{A1,
   1.6}, {A2, -4.5}, {A3, -2.9}, {B1,
   2.9}, {B2, -4}, {B3, -1.3}}, {x1, x2}]
which gives the output:
This also does not give the correct relation. Could anyone please help me to get the correct equation?
Thanks in advance.
Using Mathematica 11.0 in Windows 11 laptop


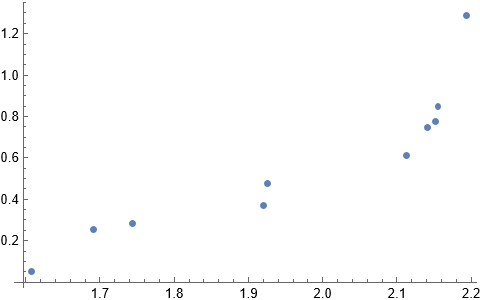
{x1,x2}coordinates fromlistofnumbersand recalculated the function value at each of those coordinates, and got pretty good results when specifying the parameter start points in your question notebook here I suspect that the objective function is very sensitive with the parameters, and a small truncation of the function values can causeNonlinearModelFitto get stuck in a local minimum that is close in objective function value to the true minimizer, but far in parameter space from the true minimizer $\endgroup$Failed to converge....warning. IncludeMaxIterations -> 5000and the results will match your generating parameters. However, expecting much from any regression function where you have 6 parameters and only 9 data points is wishful thinking. Looking at the parameter correlation matrix also results in correlations near -1 and +1 which indicates numerical instability. $\endgroup$ListPointPlot3D[listofnumbers]and you'll see that your data is unlikely to fit any model. (And I did make the assumption that you were just missing the^for your original data and made the correction.) $\endgroup$a2 = -488874*10^-9and the first value forx1is 18652. The product ofA2*x1^2is -170078. Most software won't deal with raising $e$ to the power -170078. So you need to do some scaling. Also, plugging in your coefficients don't result in the values of the response. You should put in the code that generated those "perfect" responses. $\endgroup$(ListPlot[listofnumbers[[All, {1, 2}]], PlotRange -> All]) shows a very limited set of values both in number (10 data points for 6 parameters) and location (there is high correlation between the chosen $x_1$ and $x_2$ values). All of that results in estimators of the parameters that are highly correlated (nearly overparametrized) and numerically unstable. A more uniform grid of values would be much, much better (especially if you have many more than just 10 data points). $\endgroup$