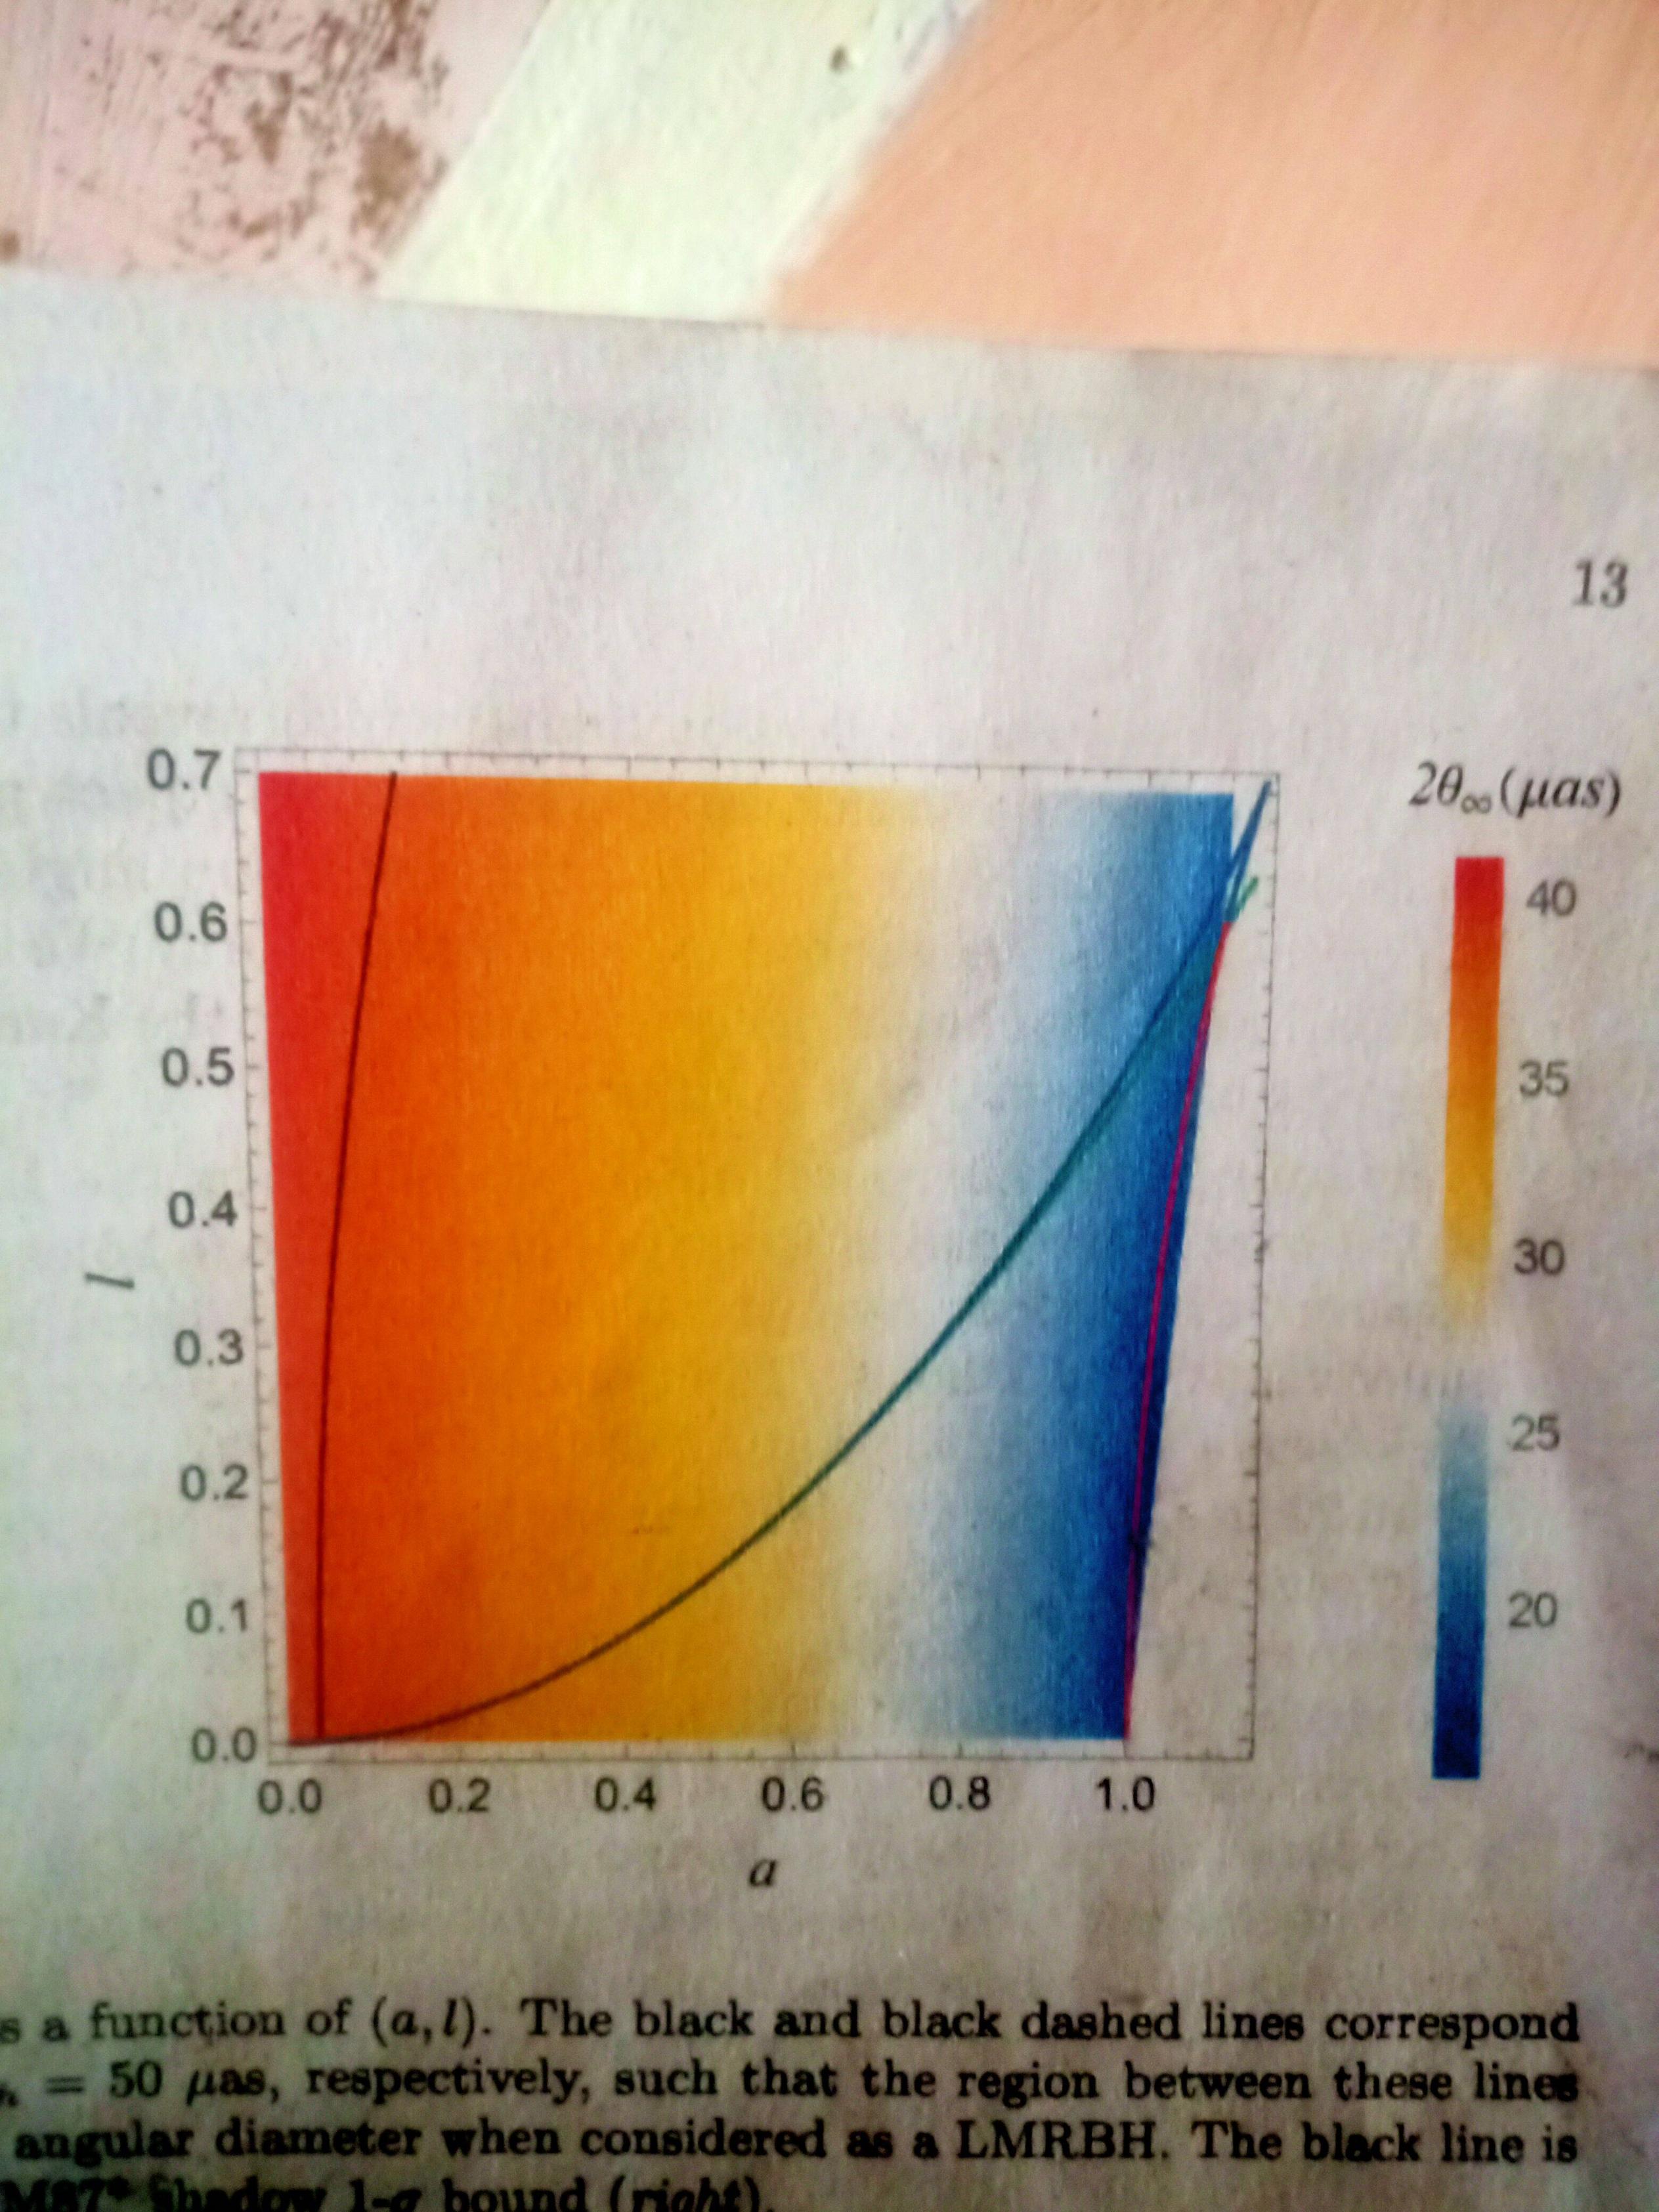
I want to plot a variable function $\theta_sh=2*\theta_\infty(b,\Gamma)$, where $q$ and $\alpha$ are parameters such that $b$ is given by $L(\gamma)$. But I am not able to set the range of parameters. I tried to make a Table of values but it didn't work. Can anyone help me? How can I find the range of both of the parameters?
L[γ_] := b /. NSolve[{A[x, b, γ] == 0 && A'[x, b, γ] == 0 &&  x > b && γ < 0 && b > 0},{x, b}, Reals] // Quiet;

θsh[b_, γ_] := 2*θm[b, γ];

Table[θsh[b, γ], {γ, 0, -1, -0.1}, {b, 0, L[γ], 0.1}]

DensityPlot[θsh[b, γ], {γ, 0, -1}, {Lγ, .01, 1}]


Aandθmare missing. $\endgroup${b, 0, L[γ], 0.1}is wrong syntax because γ is not defined. $\endgroup$