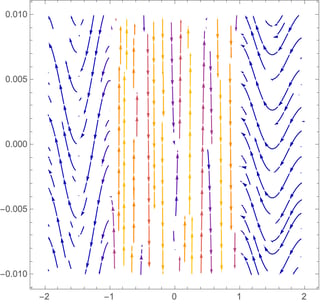
I have a solution from a 2D FEM simulation that I want to analyze in detail and
StreamPlot would be a good visualization tool for that.
I unfortunately fail to obtain some stream lines from it, thanks to the domain high aspect ratio, I believe. I have built a small toy pb to illustrate what it is.
The part I'm interested in visualizing is the "almost flat" central part of 3rd graph.
The first set of plots give a sense of what the solution is, and the problematic ones are the last two stream plots.
Any help will be much appreciated.
Needs["NDSolve`FEM`"]
theRegion=ImplicitRegion[True,{{x,-2,2},{y,-0.01,0.01}}];
theMesh=ToElementMesh[theRegion,MaxCellMeasure->0.00001]
transWidth=20;
transLoc=1;
xy=((Tanh[transWidth(x+transLoc)]-Tanh[transWidth(x-transLoc)])/2)(y Sin[2\[Pi] x]+x+x^2/4)//Simplify
xy\[CapitalDelta]=((Tanh[transWidth(x+transLoc)]-Tanh[transWidth(x-transLoc)])/2)y Sin[2\[Pi] x]//Simplify
xyG=Grad[xy,{x,y}]//Simplify
xy\[CapitalDelta]G=Grad[xy\[CapitalDelta],{x,y}]//Simplify
Plot3D[xy,{x,y}\[Element]theMesh,BoxRatios->{2,1,1/2},PlotLabel->"The solution"]
Plot3D[xy\[CapitalDelta],{x,y}\[Element]theMesh,BoxRatios->{2,1,1/2},PlotRange->All,PlotLabel->" \[CapitalDelta] = the small details"]
Plot3D[xyG[[1]],{x,y}\[Element]theMesh,BoxRatios->{2,1,1/2},PlotLabel->"Longitudinal 'full' gradient"]
Plot3D[xyG[[2]],{x,y}\[Element]theMesh,BoxRatios->{2,1,1/2},PlotLabel->"Transverse gradient "]
Plot3D[xy\[CapitalDelta]G[[1]],{x,y}\[Element]theMesh,BoxRatios->{2,1,1/2},PlotRange->All,PlotLabel->"Longitudinal '\[CapitalDelta]' gradient"]
DensityPlot[Evaluate@D[xy,x][[1]],{x,y}\[Element]theMesh,PlotRange->All,AspectRatio->1/3,MaxRecursion->4]
DensityPlot[Evaluate@D[xy,x][[2]],{x,y}\[Element]theMesh,PlotRange->All,AspectRatio->1/3,MaxRecursion->4]
DensityPlot[Evaluate@xyG[[1]],{x,y}\[Element]theMesh,PlotRange->All,AspectRatio->1/3,MaxRecursion->4]
DensityPlot[Evaluate@xy\[CapitalDelta]G[[1]],{x,y}\[Element]theMesh,PlotRange->All,AspectRatio->1/3,MaxRecursion->4]
DensityPlot[Evaluate@xy\[CapitalDelta]G[[2]],{x,y}\[Element]theMesh,PlotRange->All,AspectRatio->1/3,MaxRecursion->4]
VectorPlot[Evaluate@D[xyG,x],{x,y}\[Element]theMesh,AspectRatio->1,VectorPoints->{40,40}]
VectorPlot[Evaluate@(D[xyG,y]{1,1}),{x,y}\[Element]theMesh,AspectRatio->1,VectorPoints->{40,40}]
StreamPlot[xyG,{x,-2,2},{y,-0.01,0.01},StreamPoints->Automatic]
StreamPlot[xyG,{x,y}\[Element]theMesh,StreamPoints->Automatic]

