7
$\begingroup$

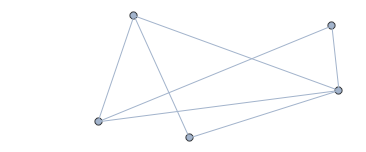
I'm trying to find a way to plot the graph

g := Graph[{a\[UndirectedEdge]b, b\[UndirectedEdge]c, c\[UndirectedEdge]a,
    a\[UndirectedEdge]d, d\[UndirectedEdge]b, d\[UndirectedEdge]e, e\[UndirectedEdge]b},d\[UndirectedEdge]c]

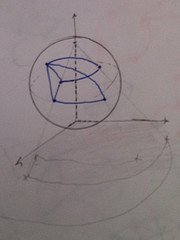
onto a sphere, so that it can be shown that although there isn't a crossing on the sphere there is when projected on the $\mathbb{R}^2$-plane. Here is something much like what I'd like to see:

$\hspace{6cm}$enter image description here

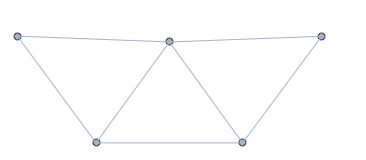
Further, how does one manipulate a graph? I mean, move the points around as you would in reality if the vertices were connected with rubber bands. This is what I'm doing as an alternative to not knowing how to manipulate graphs in Mathematica 8:

Image

$\endgroup$
6
  • $\begingroup$ I'm making the assumption that to show that a graph is planar really just boils down to showing that its ability to be drawn on the sphere is enough to show planar-ness. $\endgroup$ Commented Aug 4, 2013 at 22:51
  • $\begingroup$ Wait... Its projection onto the $\mathbb{R}^2$ would have a crossing... Wouldn't it... $\endgroup$ Commented Aug 4, 2013 at 22:53
  • $\begingroup$ Hmm... My initial thought seems a little daft because what I"m trying to do is "show that each graph is planar by redrawing it so that no edges cross," but I don't think this complicated approach is really necessary... $\endgroup$ Commented Aug 4, 2013 at 22:55
  • $\begingroup$ The graph is drawn in a plane without crossings to begin with. And the question makes it seem that that is the ultimate object as well. Is that right? Is it necessary to visualize the graph on a sphere? $\endgroup$
    – Michael E2
    Commented Aug 4, 2013 at 23:02
  • $\begingroup$ No, but I would like to be able to visualize graphs with crossing on a sphere. $\endgroup$ Commented Aug 4, 2013 at 23:10

3 Answers 3

4
$\begingroup$

Sorry to use Presentations again but it has many convenient features for complex variables, Riemann spheres and associated dynamics. I wouldn't use Graph but would specify the vertices and lines directly in the complex plane. So here are some points:

<< Presentations` 

zpoints = {-2, -1 + I, -1 - I, I, -I, 1} + 5/2;

The following specifies a network of lines on the points.

znet = {ComplexLine@zpoints[[{1, 2, 4, 6, 5, 3, 1}]],
   ComplexLine@zpoints[[{2, 3}]],
   ComplexLine@zpoints[[{4, 5}]]};

Next we draw the network in the complex plane.

Draw2D[
 {znet,
  ComplexCirclePoint[#, 3, Black, Orange] & /@ zpoints},
 ImageSize -> 250]
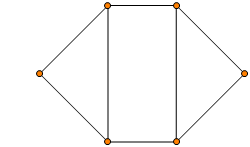
enter image description here

Next we draw the network on the Riemann sphere. ColoredRiemannSphere draws a Riemann sphere with some annotation and it can be customized in various ways. StereographicMap maps items in the complex plane onto the sphere. FineGrainLines breaks up the lines into a number of segments. This is important so that the lines can bend to fit the sphere. If one just gives the endpoints the lines would cut through the interior of the sphere. ViewRiemann is a set of plot directives that show the sphere to best advantage.

Draw3DItems[
 {ColoredRiemannSphere[],
  StereographicMap[znet // FineGrainLines[0.1, 4]]},
 ViewRiemann,
 ImageSize -> 250]
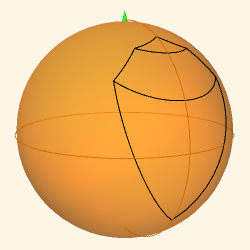
enter image description here

Finally, here is a dynamic display. The left hand plot is the network in the complex plane with the vertices defined by six movable locators. The right hand plot is the same network on the Riemann sphere. The plot on the sphere responded essentially instantly to the locators.

DynamicModule[{pt1, pt2, pt3, pt4, pt5, pt6, net, calcNet},
 {pt1, pt2, pt3, pt4, pt5, pt6} = 
  ToCoordinates[{-2, -1 + I, -1 - I, I, -I, 1}];
 calcNet[p1_, p2_, p3_, p4_, p5_, p6_] :=
  (net = {Line[{p1, p2, p4, p6, p5, p3, p1}],
      Line[{p2, p3}], Line[{p4, p5}]} // FineGrainLines[0.1, 3]);

 calcNet[pt1, pt2, pt3, pt4, pt5, pt6];

 phrase[
  Draw2D[
   {Dynamic@{net},
    DrawLocators[{pt1, pt2, pt3, pt4, pt5, pt6}, 
     CirclePointLocator[3, Red], 
     calcNet[pt1, pt2, pt3, pt4, pt5, pt6]]},
   Frame -> True,
   PlotRange -> 3,
   ImageSize -> 250],
  Spacer[5],
  Draw3DItems[
   {ColoredRiemannSphere[],
    Dynamic@StereographicMap[net]},
   ViewRiemann,
   ImageSize -> 250]]
 ] 
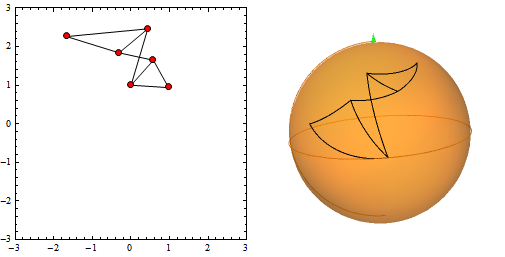
enter image description here

If the lines cross in the plane they will certainly cross on the sphere.
$\endgroup$
2
$\begingroup$

I can answer the second part, but not the first.

With respect to the first, Graph seems to produce a rather complicated object. Perhaps someone knows how to process it. One of the problems will remapping the lines, which are represented by two end point, to a circular arc, which will be represented by many short line segments. That in itself is not hard, but I balk at sticking the result back into the Graph output.

If for the second part, you're just looking for a way to play with graph by moving vertices, that's best done with Graphics, not Graph. Clicking on the graph will move the nearest Locator to the mouse; dragging will cause the Locator to follow the mouse. I gave them random starting points, which tends to yield crossings.

g0 = {a \[UndirectedEdge] b, b \[UndirectedEdge] c, c \[UndirectedEdge] a,
      a \[UndirectedEdge] d, d \[UndirectedEdge] b, d \[UndirectedEdge] e,
      e \[UndirectedEdge] b}];

DynamicModule[{a, b, c, d, e},
 {a, b, c, d, e} = Transpose@{RandomReal[2.4, 5], RandomReal[0.9, 5]};
 LocatorPane[
  Dynamic@{a, b, c, d, e},
  Dynamic@Graphics[{
     {Hue[0.6, 0.2, 0.8], EdgeForm[{GrayLevel[0], Opacity[0.7]}], 
      Disk[#, 0.025] & /@ {a, b, c, d, e}},
     {Hue[0.6, 0.2, 0.8], 
      Line[List @@@ g0]}
     }, PlotRange -> {{-0.1, 2.5}, {-0.1, 1}}],
  Appearance -> None
  ]
 ]

Mathematica graphics

The following simply converts the description of a Graph into a list of pairs of end points for Line:

List @@@ g0
(* {{a, b}, {b, c}, {c, a}, {a, d}, {d, b}, {d, e}, {e, b}} *)

If you wish to start with the layout of

g = Graph[{a \[UndirectedEdge] b, b \[UndirectedEdge] c, c \[UndirectedEdge] a,
           a \[UndirectedEdge] d, d \[UndirectedEdge] b, d \[UndirectedEdge] e, 
           e \[UndirectedEdge] b}];

then replace the initialization of {a, b, c, d, e,} with

{a, b, c, d, e} = Cases[FullGraphics @ g, TagBox[DiskBox[pts_, rad_], __] :> pts, 
                        Infinity];

Mathematica graphics

In general, you may have to adjust PlotRange to suit the graph. See for instance this answer for how to get the PlotRange from Graphics; be sure to apply it FullGraphics @ g and not just g.

$\endgroup$
2
$\begingroup$

There is some inconsistency in the coding of the graph: an extra edge outsode brackets/ However, this approach may be helpful. You can change/correct graph.

f[z_] := Module[{den}, 
   den = 1 + z[[1]]^2 + z[[2]]^2; {2 z[[1]]/den, 
    2 z[[2]]/den, (den - 2)/den}];
l[a_, b_, t_] := t a + (1 - t) b
tab[{a_, b_}] := f /@ Table[l[a, b, t], {t, 0, 1, 0.02}];

DynamicModule[{elist = {{1, 2}, {2, 3}, {3, 1}, {1, 4}, {4, 2}, {4, 
     5}, {5, 2}}, pt = {{-2, 1}, {-1, -1}, {-2, 0}, {0, 0}, {0, -1}}},
  GraphicsRow[{LocatorPane[
    Dynamic[pt], Graphics[{Line /@ (Dynamic[pt[[#]] & /@ elist])}]
    ],
   Graphics3D[{Sphere[], {PointSize[0.05], Point /@ Dynamic[f /@ pt]},
     {Line /@ Dynamic[tab /@ (pt[[#]] & /@ elist)]}}, 
    PlotRange -> Table[{-1, 1}, {3}]]}]
 ]

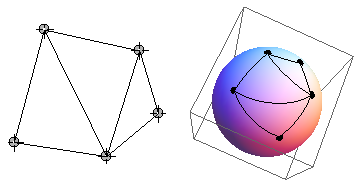
A snapshot follows:

enter image description here

$\endgroup$

Your Answer

By clicking “Post Your Answer”, you agree to our terms of service and acknowledge you have read our privacy policy.

Not the answer you're looking for? Browse other questions tagged or ask your own question.