I can answer the second part, but not the first.
With respect to the first, Graph seems to produce a rather complicated object. Perhaps someone knows how to process it. One of the problems will remapping the lines, which are represented by two end point, to a circular arc, which will be represented by many short line segments. That in itself is not hard, but I balk at sticking the result back into the Graph output.
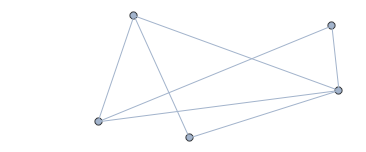
If for the second part, you're just looking for a way to play with graph by moving vertices, that's best done with Graphics, not Graph. Clicking on the graph will move the nearest Locator to the mouse; dragging will cause the Locator to follow the mouse. I gave them random starting points, which tends to yield crossings.
g0 = {a \[UndirectedEdge] b, b \[UndirectedEdge] c, c \[UndirectedEdge] a,
      a \[UndirectedEdge] d, d \[UndirectedEdge] b, d \[UndirectedEdge] e,
      e \[UndirectedEdge] b}];

DynamicModule[{a, b, c, d, e},
 {a, b, c, d, e} = Transpose@{RandomReal[2.4, 5], RandomReal[0.9, 5]};
 LocatorPane[
  Dynamic@{a, b, c, d, e},
  Dynamic@Graphics[{
     {Hue[0.6, 0.2, 0.8], EdgeForm[{GrayLevel[0], Opacity[0.7]}],
      Disk[#, 0.025] & /@ {a, b, c, d, e}},
     {Hue[0.6, 0.2, 0.8],
      Line[List @@@ g0]}
     }, PlotRange -> {{-0.1, 2.5}, {-0.1, 1}}],
  Appearance -> None
  ]
 ]

The following simply converts the description of a Graph into a list of pairs of end points for Line:
List @@@ g0
(* {{a, b}, {b, c}, {c, a}, {a, d}, {d, b}, {d, e}, {e, b}} *)
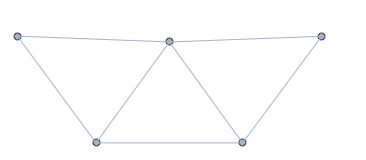
If you wish to start with the layout of
g = Graph[{a \[UndirectedEdge] b, b \[UndirectedEdge] c, c \[UndirectedEdge] a,
           a \[UndirectedEdge] d, d \[UndirectedEdge] b, d \[UndirectedEdge] e,
           e \[UndirectedEdge] b}];
then replace the initialization of {a, b, c, d, e,} with
{a, b, c, d, e} = Cases[FullGraphics @ g, TagBox[DiskBox[pts_, rad_], __] :> pts,
                        Infinity];

In general, you may have to adjust PlotRange to suit the graph. See for instance this answer for how to get the PlotRange from Graphics; be sure to apply it FullGraphics @ g and not just g.


