2
$\begingroup$

I obtain a set of points which are the solutions of f[b, c, d] == 0 by this code

f[b_, c_, d_] = -11 c^4 - 4 c^2 b + (7 + b) c + 8 (c + d/9) d^3;

points = N[{b, c, d} /. FindInstance[f[b, c, d] == 0 && -(1/2) < b < 0  && -1/2 < c < 0 &&   0 < d < 6, {b, c, d}, 3]]

(*  {{-0.472637, -0.344828, 3.17978}, {-0.313433, -0.44335,  4.04363}, {-0.0447761, -0.216749, 2.12847}} *)

Question. Then, I want to plot another function g at those obtained points. In the code below, I substituted the points manually, how can I ask Mathematica to do this replacement by a code (I mean without putting them by hand)?

g = (-7 b^2)/(c + 2  d)^6;

p1 = Plot[g /. {b -> -0.472636815920398` , c -> -0.3448275862068966`, d ->3.179783265064255` }, {t, 0, 3}];

p2 = Plot[g /.{b -> -0.31343283582089554`, c-> -0.4433497536945813`, d -> 4.043627580473731` }, {t, 0, 3}];

p3 = Plot[g /. {b -> -0.04477611940298507`, c -> -0.21674876847290642`, d ->2.1284701801564667`}, {t, 0, 3}];

$\endgroup$

3 Answers 3

1
$\begingroup$

Try

Map[(-7 b^2)/(c + 2 d)^6 /. {b -> #[[1]], c -> #[[2]],d -> #[[3]]} &, points]
(*{-0.0000330257, -3.44743*10^-6, -3.22685*10^-6}*)
$\endgroup$
1
$\begingroup$

The result of the FindInstance is already a list of rules:

solns = FindInstance[f[b, c, d] == 0 && -(1/2) < b < 0 && -1/2 < c < 0 && 0 < d < 6, {b, c, d}, 3];
N[solns]
(* {{b -> -0.472637, c -> -0.344828, d -> 3.17978}, 
    {b -> -0.313433, c -> -0.44335, d -> 4.04363}, 
    {b -> -0.0447761, c -> -0.216749, d -> 2.12847}} *)

So you can use that to do your replacements:

g /. solns // N
(* {-0.00003302573111062388, -3.4474279611533065*^-6, 3.2268529976080994*^-6} *)

You can access them one at a time:

g /. solns[[1]] // N
(* -0.00003302573111062388 *)

Alternatively, you could define a related function:

g2[b_, c_, d_] := Evaluate[g];

g2 @@@ points
(* {-0.00003302573111062388, -3.4474279611533065*^-6, -3.2268529976080994*^-6} *)

This depends on the order of the arguments, so, another option would be to build a function based on your knowledge of the position of each argument you used to create points:

g3 = (-7 #[[1]]^2)/(#[[2]] + 2 #[[3]])^6 &;

g3 /@ points
(* {-0.00003302573111062388, -3.4474279611533065*^-6, -3.2268529976080994*^-6} *)
$\endgroup$
1
$\begingroup$
$Version

(* "14.0.0 for Mac OS X ARM (64-bit) (December 13, 2023)" *)

Clear["Global`*"]

f[b_, c_, d_] = -11  c^4 - 4  c^2  b + (7 + b)  c + 8  (c + d/9)  d^3;

n = 750;

solns = FindInstance[
   f[b, c, d] == 0 && -(1/2) < b < 0 && -1/2 < c < 0 && 0 < d < 6, {b,
     c, d}, n];

g = (-7  b^2)/(c + 2   d)^6 /. solns;

#[g // N] & /@ {Min, Mean, Median, Max, StandardDeviation}

(* {-3.40868, -0.0406408, -0.0000272051, -5.68232*10^-10, 0.26728} *)

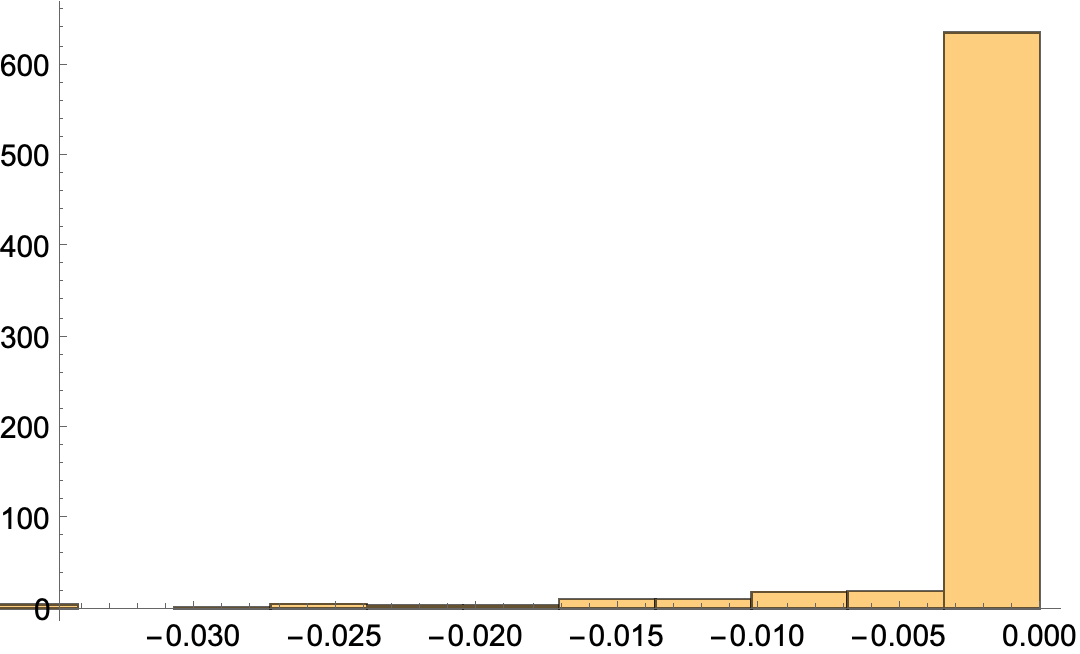
Given the values of b, c, d, g is just a number. Perhaps by plot you mean a Histogram of its values.

Histogram[g]

enter image description here

$\endgroup$

Your Answer

By clicking “Post Your Answer”, you agree to our terms of service and acknowledge you have read our privacy policy.

Not the answer you're looking for? Browse other questions tagged or ask your own question.