1
$\begingroup$

I am using this code

Clear[a, b, f, dx, dy];
{a, b} = {2, 2};
{dx, dy} = {Subdivide[0, a, 3], Subdivide[0, b, 3]};
f[x_, y_] = {x, y};


p1 = ParametricPlot[f @@ {x, y}, {x, 0, a}, {y, 0, b}, Mesh -> {dx, dy}, 
 Epilog -> {PointSize[Medium], Black, 
 Point[f @@@ Tuples[{dx, dy}]]}, Frame -> False, Axes -> False,  PlotStyle -> None];


p2 = Graphics[ {{Thickness[0.9], Yellow, Opacity[1],CapForm["Butt"],Line[{{0.4, 0.75}, {0.9, 0.75}}]}, 
{Inset[Style["word1", 20], {0.67, 1.28}]   } , 
{Inset[Style["word2", 20], {0.67, 0.58}]   }  }  ];


 Show[{p1, p2}, PlotRange -> {{0, 1.3}, {0.3, 1.6}} ]

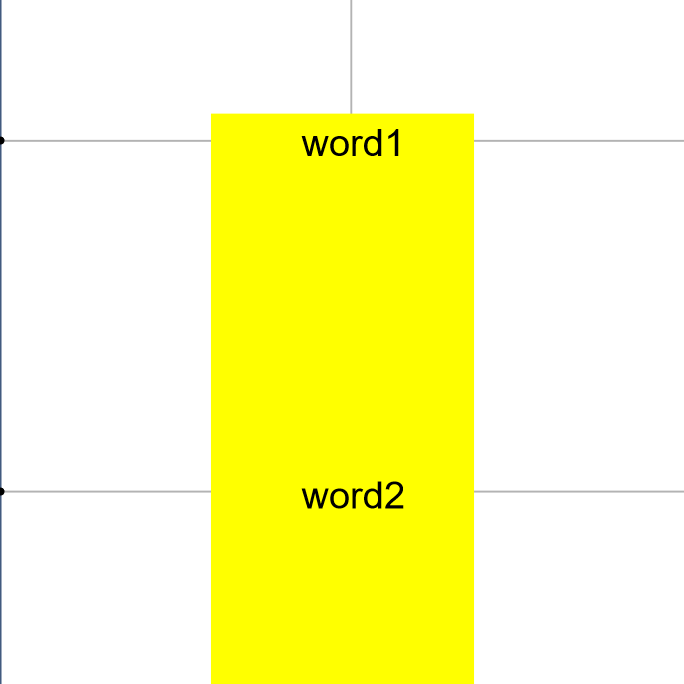
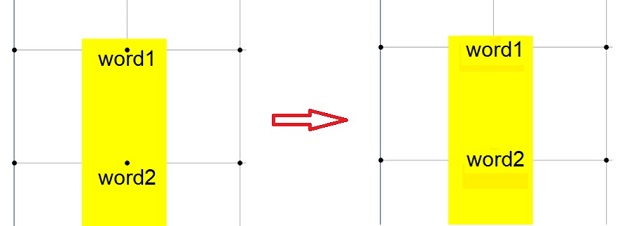
and the result is the left picture below

enter image description here

My question: I want to remove only those two mesh points inside my yellow box, and then put my words instead of them (something like the right plot); how can I do that?

$\endgroup$

1 Answer 1

4
$\begingroup$

You can put everything in the Epilog.

p2 = {PointSize[Medium], Black, 
   Point[f @@@ Tuples[{dx, dy}]], {Thickness[0.9], Yellow, Opacity[1],
     CapForm["Butt"], 
    Line[{{0.4, 0.8}, {0.9, 0.8}}]}, {Inset[
     Style["word1", 20], {0.67, 1.33}]}, {Inset[
     Style["word2", 20], {0.67, 0.66}]}};

ParametricPlot[f @@ {x, y}, {x, 0, a}, {y, 0, b}, Mesh -> {dx, dy}, 
 Epilog -> p2, Frame -> False, Axes -> False, PlotStyle -> None, 
 PlotRange -> {{0, 1.3}, {0.3, 1.6}}]

enter image description here

$\endgroup$

Your Answer

By clicking “Post Your Answer”, you agree to our terms of service and acknowledge you have read our privacy policy.

Not the answer you're looking for? Browse other questions tagged or ask your own question.