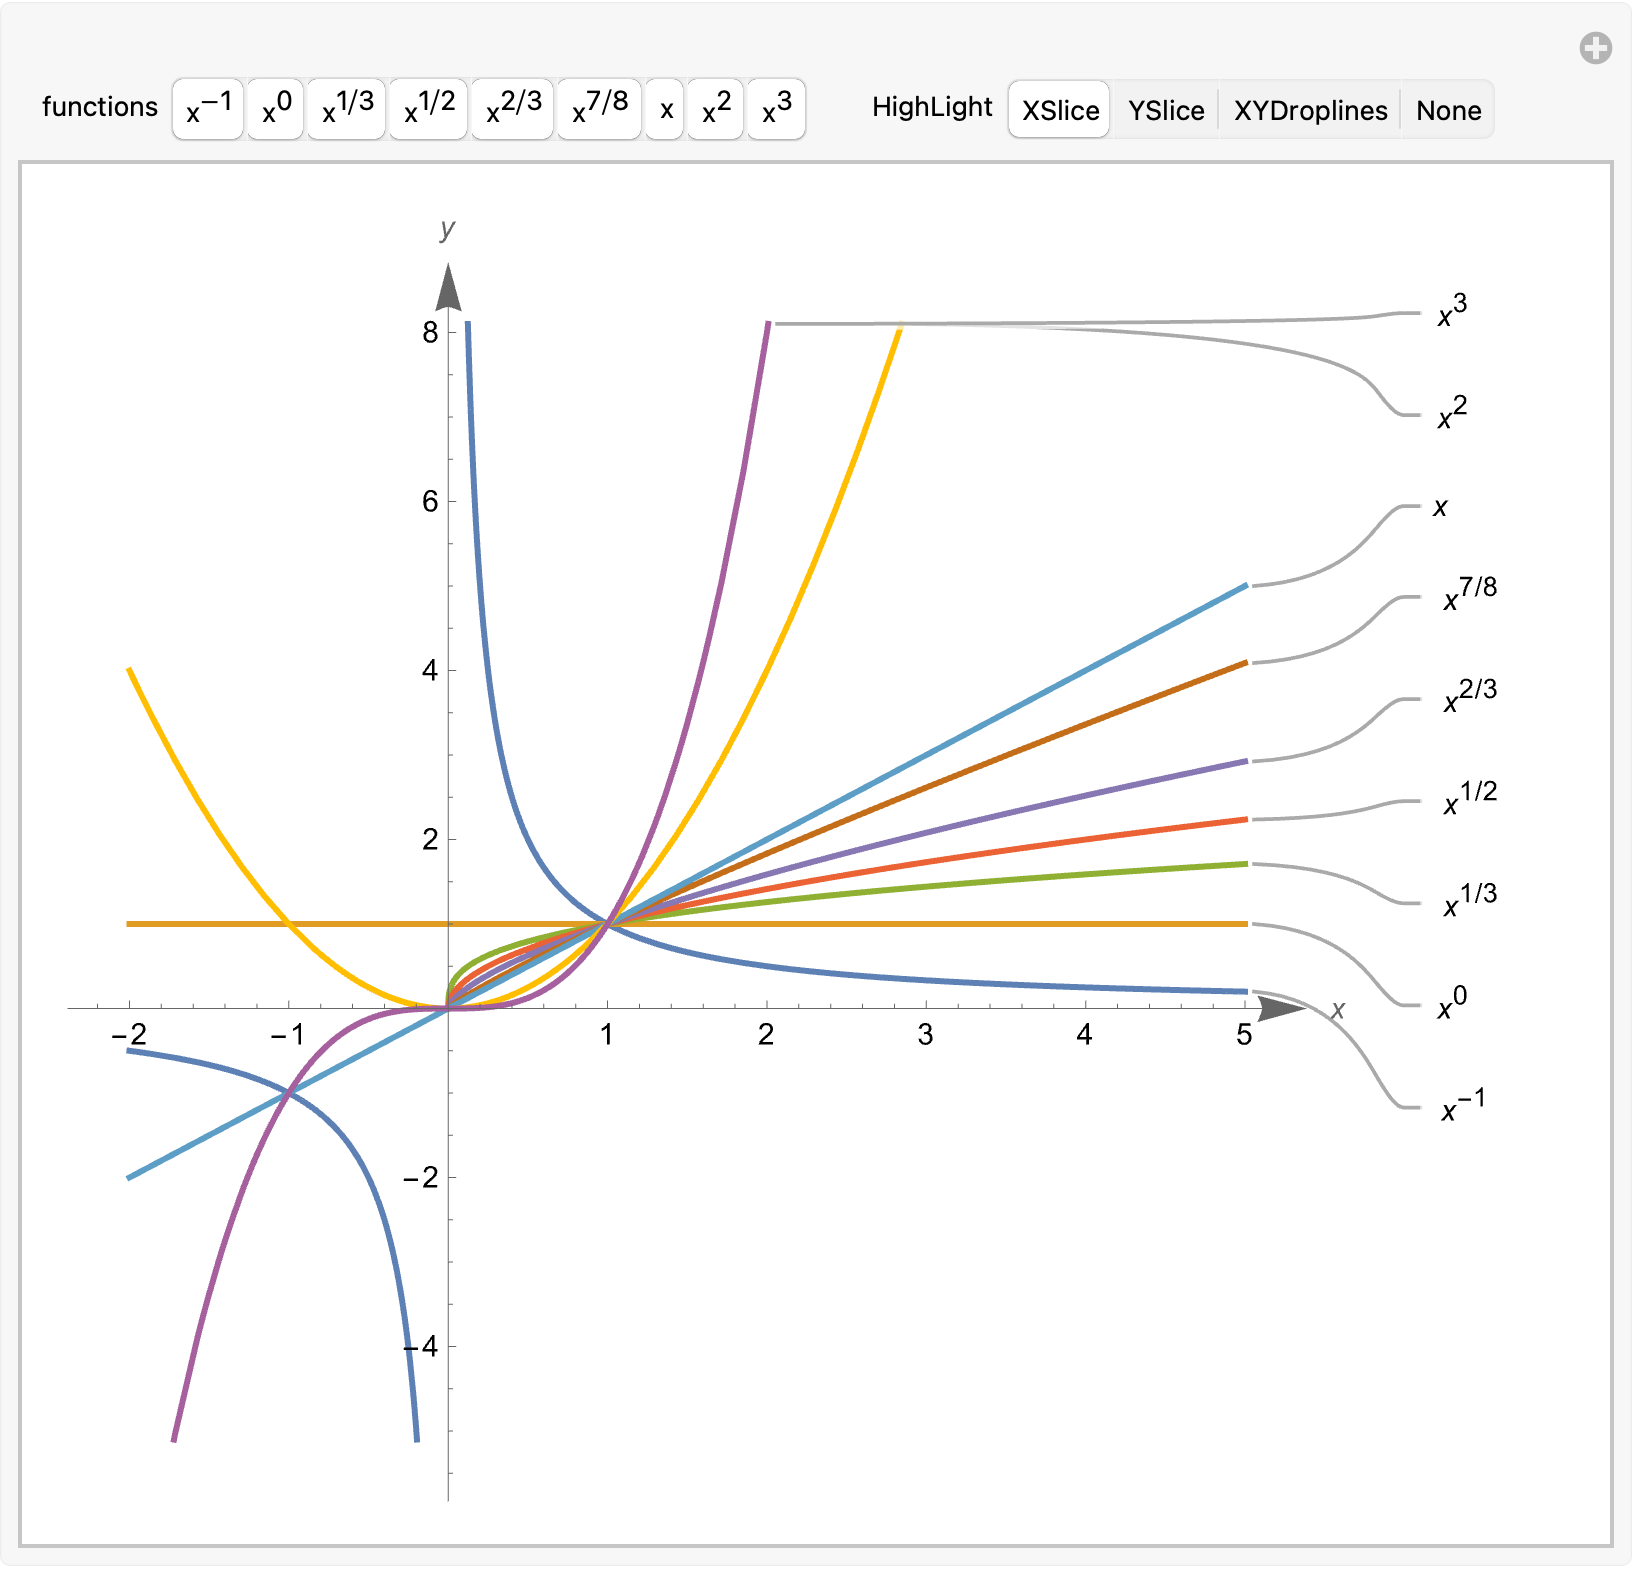
For plots with many possible functions, use a TogglerBar to enable selectively showing or hiding the individual functions.
$Version

(* "13.3.1 for Mac OS X ARM (64-bit) (July 24, 2023)" *)

Clear["Global`*"]

labels =
  {x^("-1"), x^"0", x^("1/3"), x^("1/2"), x^("2/3"), x^("7/8"), x, x^2, x^3} //
   ToRadicals;

funcs = labels /. str_String :> ToExpression[str];

colors = ColorData[97, "ColorList"];
Display
Manipulate[
 index = Sort@index;
 Plot[Evaluate@(Tooltip /@ funcs[[index]]), {x, -2, 5},
  PlotRange -> {{-2, 5}, {-5.1, 8.1}},
  PlotRangePadding -> Scaled[.05],
  AspectRatio -> 1,
  PlotStyle -> colors[[index]],
  PlotLabels -> labels[[index]],
  Axes -> True,
  AxesStyle -> Arrowheads[{0.0, 0.04}],
  AxesLabel -> {x, y},
  ImageSize -> 500,
  PlotHighlighting -> hilite],
 Row[{
   Control[{{index, Range@Length@funcs, "functions"},
     Thread[(Range@Length@funcs) -> labels],
     ControlType -> TogglerBar}],
   Spacer[20],
   Control[{{hilite, "XSlice", "HighLight"},
     {"XSlice", "YSlice", "XYDroplines", None}}]}]]


