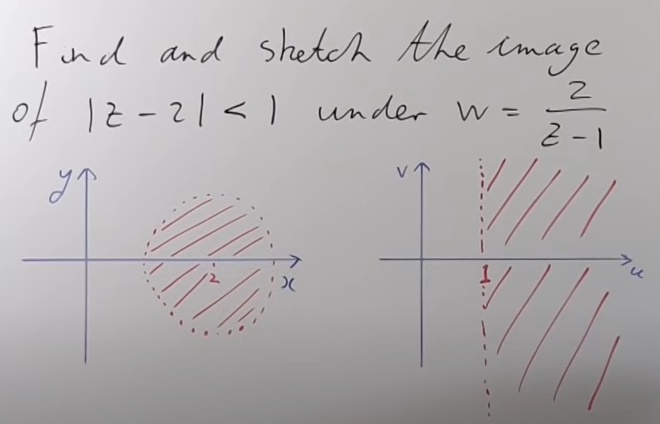
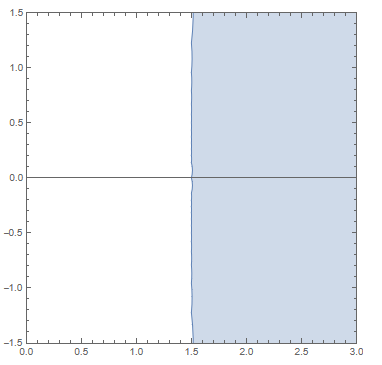
How can I plot the image of |z-2| < 1 under the transformation w = z/(z-1)? The expected result should look something like this.
3 Answers
$\begingroup$
$\endgroup$
1
- We mapping the region
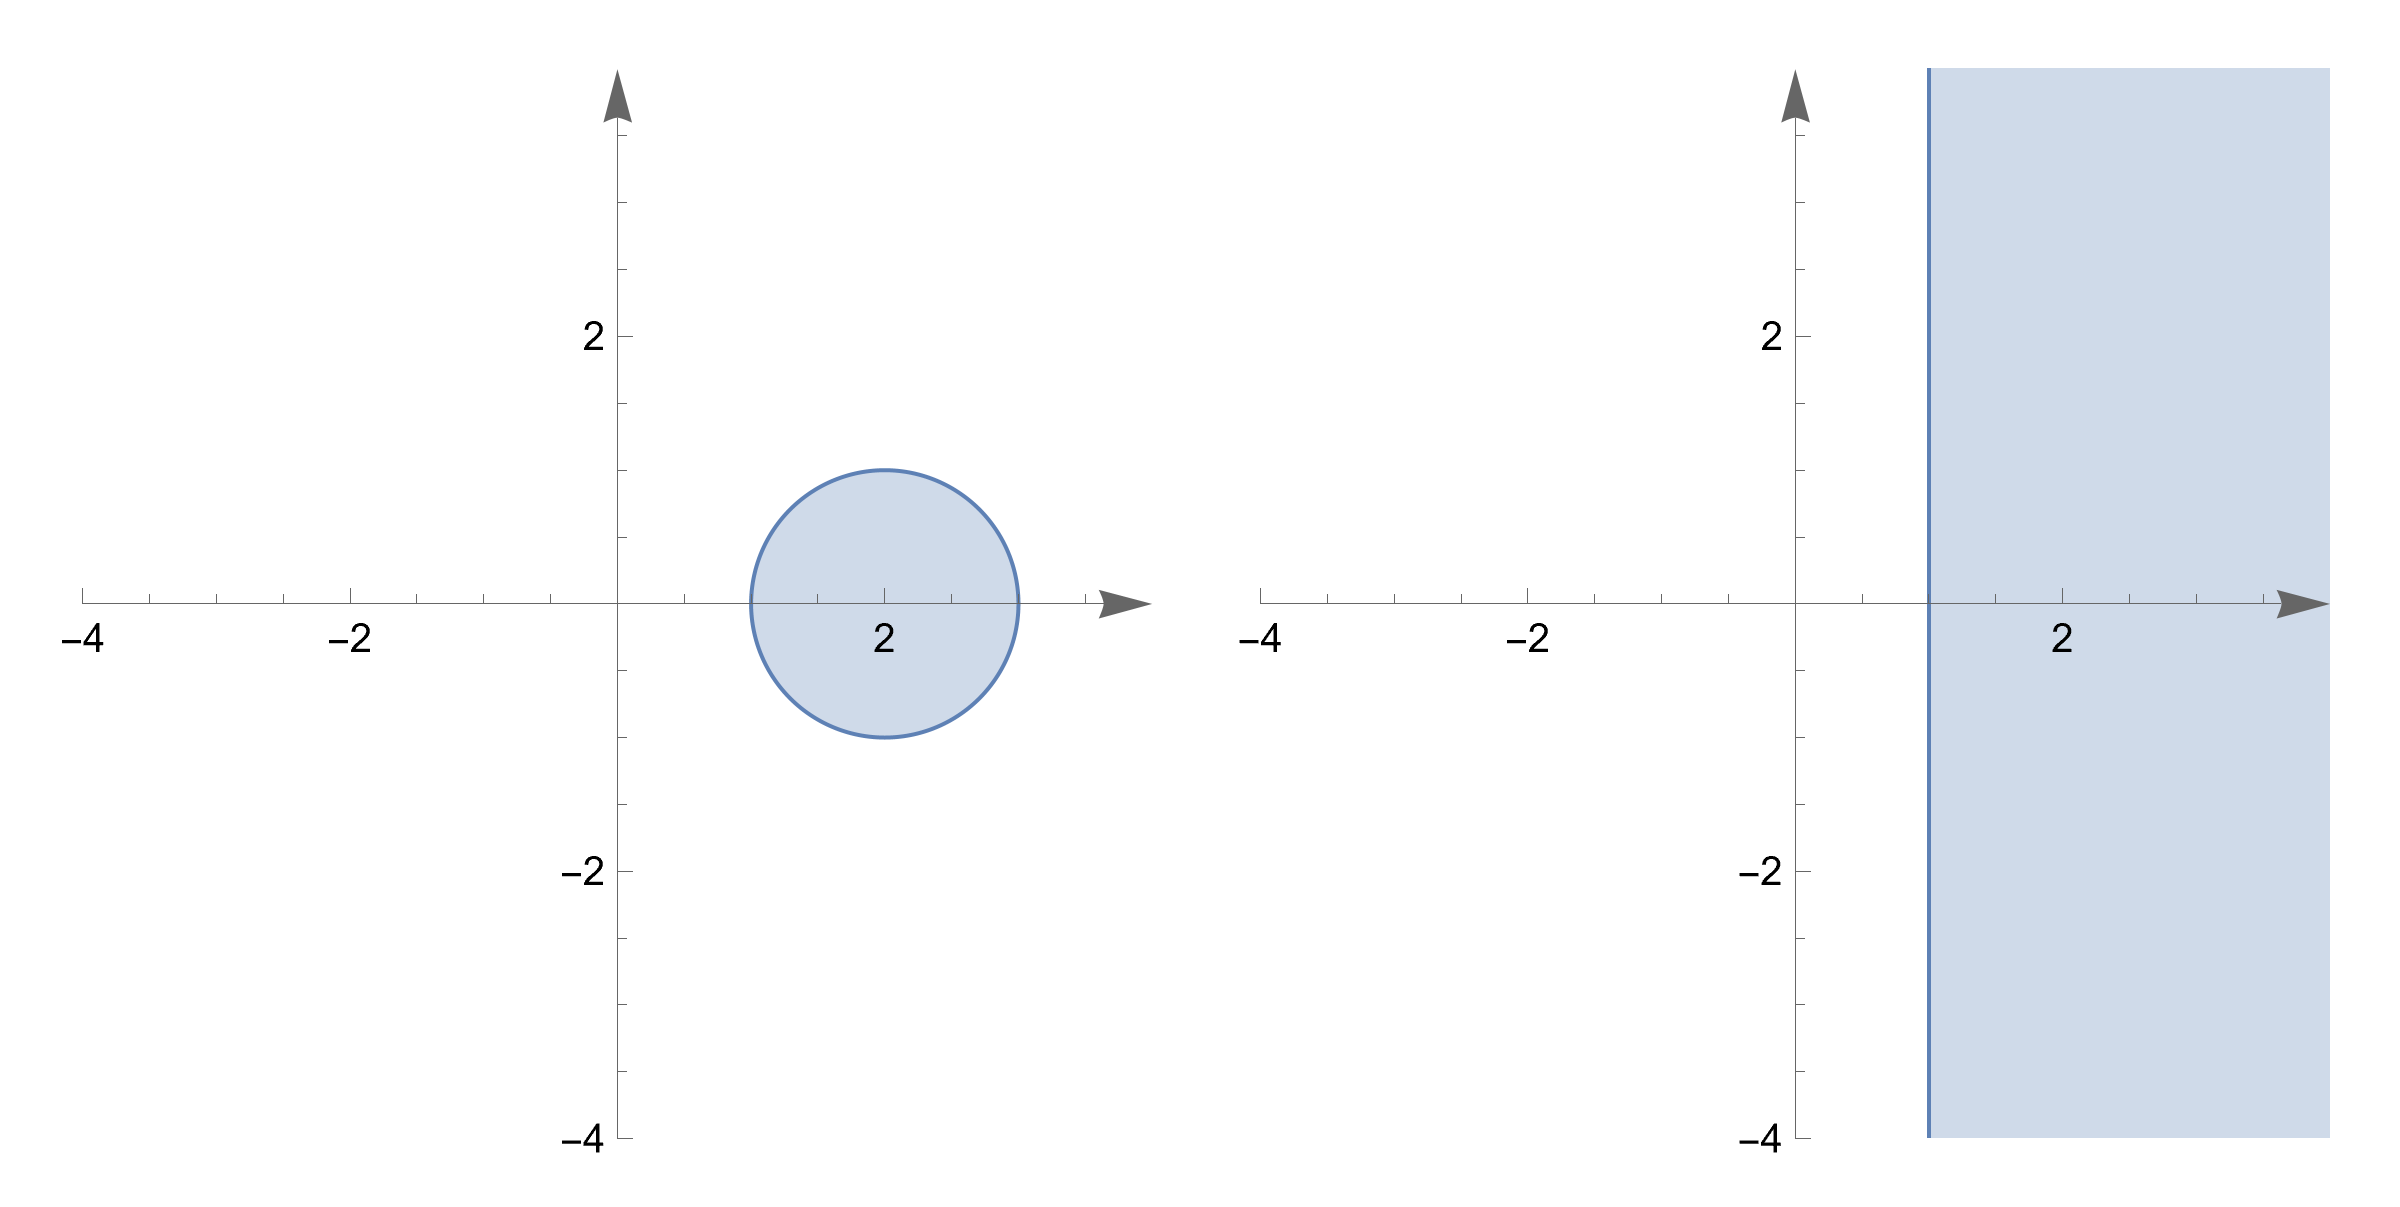
ImplicitRegion[Abs[z - 2] < 1, {x, y}]to another region by thez( identity mapping) and2/(z - 1).
plot=Block[{z = x + I*y},
   ParametricPlot[#, {x, y} ∈
     ImplicitRegion[Abs[z - 2] < 1, {x, y}], PlotRange -> 4,
    Axes -> True, Frame -> False,
    AxesStyle -> Arrowheads[.05]]] & /@ {ReIm[z], ReIm[2/(z - 1)]};
GraphicsRow[plot]
-
$\begingroup$ +1. A good code is a commented code. $\endgroup$ Commented Dec 1, 2023 at 15:37
$\begingroup$
$\endgroup$
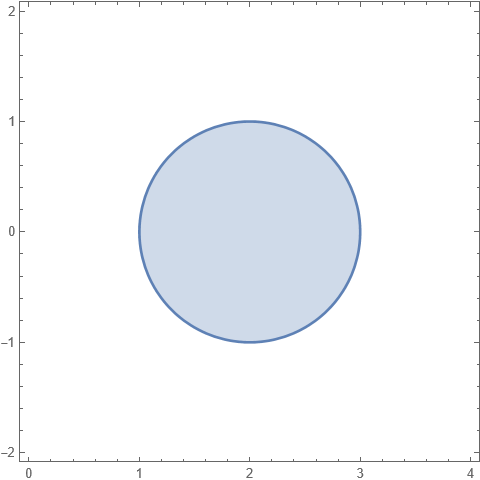
First plot:
ComplexRegionPlot[Abs[z - 2] <= 1, {z, 0 - 2 I, 4 + 2 I}]
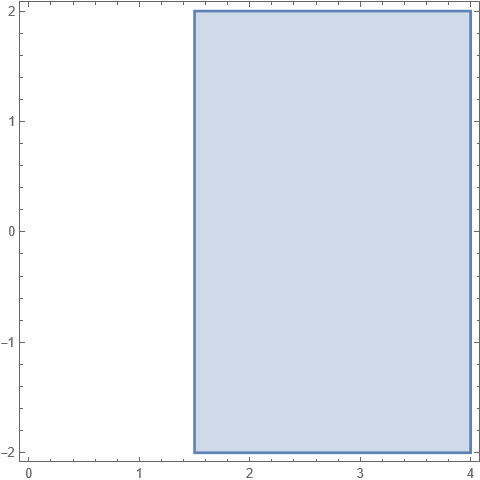
After transformation:
transformed = Abs[z - 2] <= 1 /. First@Solve[w == z/(z - 1), z]
ComplexRegionPlot[transformed, {w, 0 - 2 I, 4 + 2 I}]
$\begingroup$
$\endgroup$
With z= x+ y I and w:
w[x_, y_] = (x + y I)/(x + y I - 1);
we can vary x from 1 to 3. And y from -Sqrt[1 - (x - 2)^2] to Sqrt[1 - (x - 2)^2], we can plot the image of the circle:
ParametricPlot[
 ReIm[w[x, y]], {x, 1, 3}, {y, -Sqrt[1 - (x - 2)^2],
  Sqrt[1 - (x - 2)^2]}, PlotRange -> {{0, 3}, {-1.5, 1.5}}]

z = x + i yandw = u + i v. $\endgroup$