0
$\begingroup$

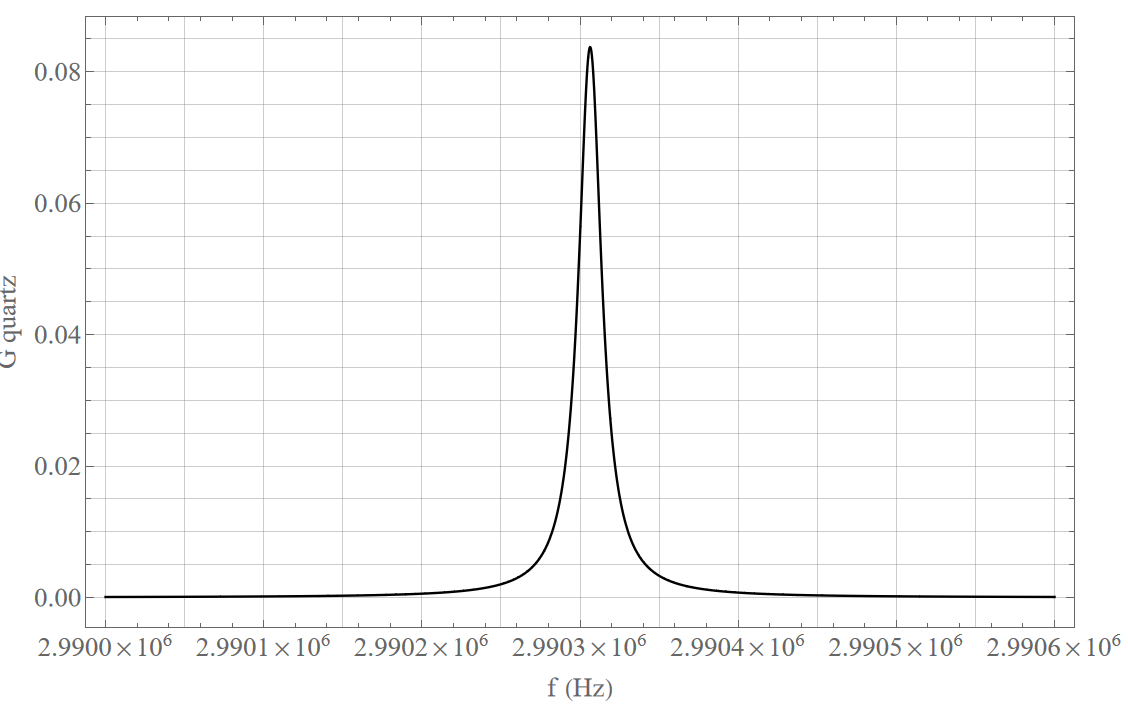
I am plotting the Real part of a complex equation which looks like this:

enter image description here

for now, using the FindMaximum function I can get the max y and max x of the plot, any ideas on how to get the FWHM of this peak?

the code I am using is:

Rhoq = 2.648*10^3; (**density of quartz crystal**)

Muq0 = 2.947*10^10; (**shear elastic modulus of quartz**),

CurlyEpsilonq = Superscript[3.982, -11]; (**permittivity**), 

eq = Superscript[9.657, -2]; (**piezoelectric constant**)

Etaq = Superscript[9.27, -3]; (**effective quartz viscocity**)

f0 = 3*10^6; (**fundamental frequency of quartz AT 5 Mhz crystal**)

electrodediameter = Superscript[6, -3]; (**diameter of the front electrode**)

A=2*Pi*(electrodediameter/2)^2;

Zacoustic = Sqrt[Muq0*Rhoq];

vq0=Sqrt[Muq0/Rhoq];

hq=vq0/2*f0; (**thickness of the crystal**)

k=(eq^2)/(eq*Muq0);

capacitance=(A*CurlyEpsilonq/hq); 

Muq=Function[{f}, Muq0+I*2*Pi*Etaq];

vq=Function[{f},Sqrt[Muq[f]/Rhoq]];

CurlyPhi=Function[{f},(2*Pi*f*hq/vq[f])];

Zquartz =Function[{f},(1/(I*2*Pi*f*capacitance))*(CurlyPhi[f]/(2*k*Tan[CurlyPhi[f]/2])-1)];

Y0 = Function[{f}, I*2*Pi*f*capacitance + 1/Zquartz[f]];

imagY0 = Function[{f}, Im[Y0[f]]];

realY0 = Function[{f}, Re[Y0[f]]];

ampY0 = Function[{f}, Abs[Y0[f]]];

Plot[realY0[f], {f, 2.99*10^6, 2.9906*10^6}, FrameLabel -> {"f (Hz)", "G quartz"}, Axes -> False, LabelStyle -> {FontFamily -> "Times New Roman", FontSize -> 18}, PlotRange -> Full, Frame -> True, GridLines -> Full, PlotStyle -> Black]

I tried to use the following:

maxquartzG1 = FindMaximum[realY0[f], {f, 2.99*10^6, 2.9906*10^6}][[1]];
halfG1=maxquartzG1/2;
f/.FindRoot[realY0[f]==halfG1,{f, 2.99*10^6, 2.9906*10^6}[[1]] 

but this gives me one solution for frequency.

Thank you in advance,

Ioanna

$\endgroup$
3
  • $\begingroup$ Your code has syntax errors: look at: vq = Function[{f}, Sqrt(Muq[f]/Rhoq);.... $\endgroup$ Commented Nov 24, 2023 at 15:31
  • $\begingroup$ In addition to multiple syntax errors, you have undefined constants, e.g., A and k $\endgroup$
    – Bob Hanlon
    Commented Nov 24, 2023 at 16:15
  • $\begingroup$ heeey... so sorry guys, I am using the Basic math assistant. I am trying to fix it now. Thank you so much $\endgroup$
    – Joanna
    Commented Nov 24, 2023 at 16:22

1 Answer 1

1
$\begingroup$

I couldn't get your code to run to generate your function, so let's just use a standard normal distribution pdf as our example function to find FWHM with.

f[x_] = PDF[NormalDistribution[], x];

We'll start by maximizing the function, and getting the value at the max along with the coordinate of the maximum:

{maxVal, maxPos} = FindMaximum[f[x], x];
maxPos = maxPos // Values // First;

And then get the positions where the function reaches half its max on both the left and right sides of the peak, and taking the difference between the two to get the FWHM:

left = NArgMin[{(f[x] - 0.5 maxVal)^2, x <= maxPos}, x];
right = NArgMin[{(f[x] - 0.5 maxVal)^2, x >= maxPos}, x];
right - left
(*2.35482*)

Note using NArgMin might not be the most optimal way to find the half-max points. There's probably a faster way to do this

Let's put this all together as a function so we can apply it to arbitrary functions

FWHM[f_] := (
  {maxVal, maxPos} = FindMaximum[f[x], x];
  maxPos = maxPos // Values // First;
  
  left = NArgMin[{(f[x] - 0.5 maxVal)^2, x <= maxPos}, x];
  right = NArgMin[{(f[x] - 0.5 maxVal)^2, x >= maxPos}, x];
  
  right - left
  )

Testing with noisy data

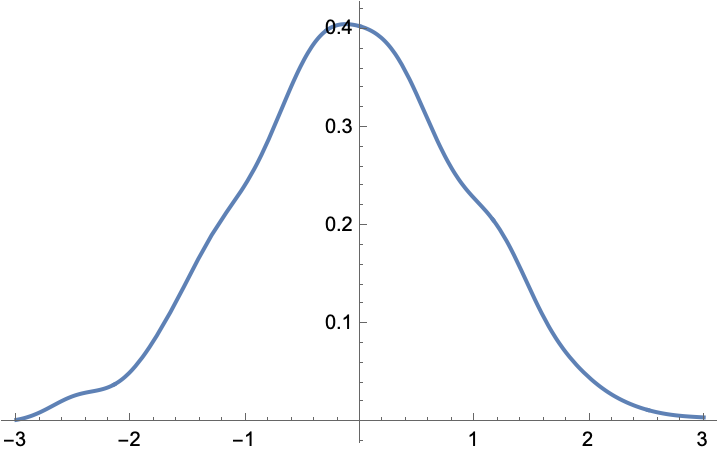
Let's try to find the FWHM of the PDF of a SmoothKernelDistribution fitted from normally distributed random data. First simulate the data and fit a SmoothKernelDistribution:

SeedRandom[1];
dat = RandomVariate[NormalDistribution[], 10^3];
ClearAll[emp]
emp[x_] = PDF[SmoothKernelDistribution[dat], x];
Plot[emp[x], {x, -3, 3}]

https://i.sstatic.net/1tVDO.png And now call FWHM on it. We see it's close to the theoretical FWHM value for a normal distribution $ \mathrm{FWHM} = 2 \sqrt{2 \log (2)} ~\sigma \approx 2.355 ~\sigma$ :

FWHM[emp]
(*2.41349*)

It's also worth noting: for many common "bump-like" functions, there are formula for the FWHM in terms of the function parameters, so often times you just fit the data to whatever appropriate function type, and use the fitted parameters to calculate FWHM.

$\endgroup$

Your Answer

By clicking “Post Your Answer”, you agree to our terms of service and acknowledge you have read our privacy policy.

Not the answer you're looking for? Browse other questions tagged or ask your own question.