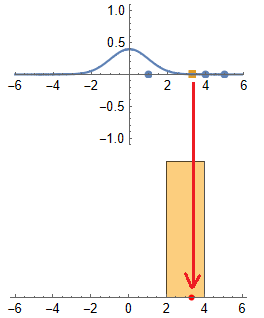
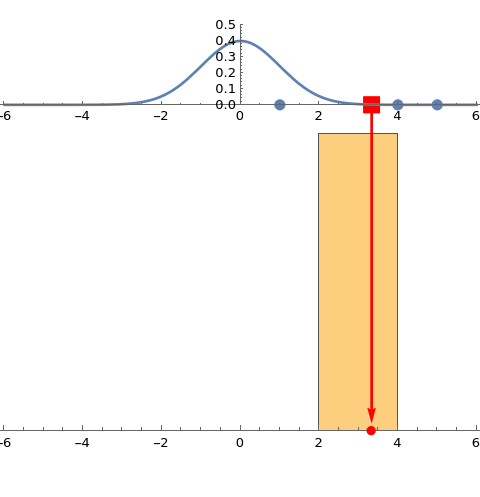
To add Arrow connecting the red point across two Show[] function result as below, Could I know how to modify my code?
trialSet = {1, 4, 5};
sampleMean = Mean[trialSet];
Column[
 {(*Upper Graph *)
  Show[ListPlot[{Transpose[{trialSet,
       ConstantArray[0, 3]}], {Style[{Mean[trialSet], 0}, Red,
       PointSize @ .06]} } , PlotMarkers -> {Automatic, 0.04}    ,
    PlotRange -> {{-6, 6}, Automatic}, Axes -> {True, True}],
   Plot[PDF[NormalDistribution[0, 1], x], {x, -6, 6},
    PlotRange -> Full]],
  (*Lower Graph*)
  Show[Histogram[{sampleMean}, PlotRange -> {{-6, 6}, Automatic}],
   NumberLinePlot[Style[sampleMean, Red], {x, -6, 6}, Spacings -> 0],
   Axes -> {True, False}]}
 ]


