2
$\begingroup$

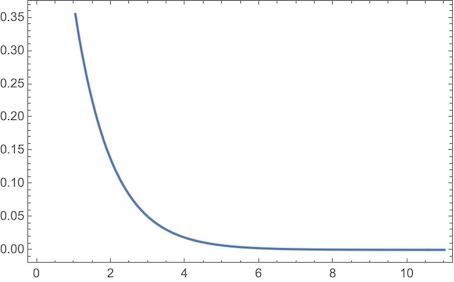
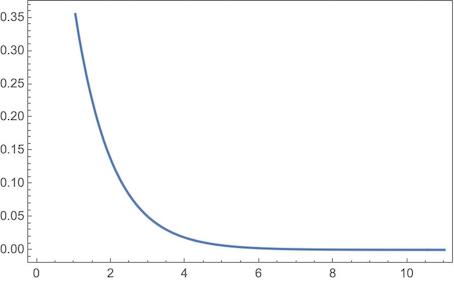
I want to change the ticks on the right and top axes on a plot like this example:

Show[Plot[Exp[-t], {t, 0, 11}, Frame -> True, 
  FrameTicksStyle -> Directive[Thickness[0.002]]]]

However, only the ticks on the left and bottom axes are changed.

enter image description here

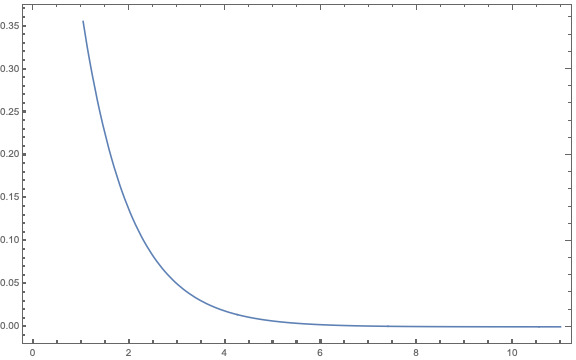
I played around with curly brackets and no luck. How can I match the ticks on the top and right axes to match the bottom and left axes?

$\endgroup$
1
  • 1
    $\begingroup$ this is likely a version/OS-related problem; your code gives the expected output in version 13.3.1 (Linux x86 - 64-bit). $\endgroup$
    – kglr
    Commented Sep 21, 2023 at 19:10

1 Answer 1

1
$\begingroup$
Plot[Exp[-t], {t, 0, 11},
 Frame -> True,
 FrameTicksStyle -> {{Automatic, Thickness[0.002]}, {Automatic, Thickness[0.002]}}]

enter image description here

To hide the ticks:

Plot[Exp[-t], {t, 0, 11},
 Frame -> True,
 FrameTicks -> {{Automatic, None}, {Automatic, None}}]

enter image description here

$\endgroup$
1
  • $\begingroup$ Unfortunately that doesn't solve my problem --- this soln gives me a regular plot, whose ticks' thickness have not been changed. $\endgroup$
    – 00123456
    Commented Sep 21, 2023 at 17:24

Your Answer

By clicking “Post Your Answer”, you agree to our terms of service and acknowledge you have read our privacy policy.

Not the answer you're looking for? Browse other questions tagged or ask your own question.