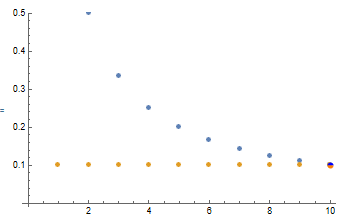
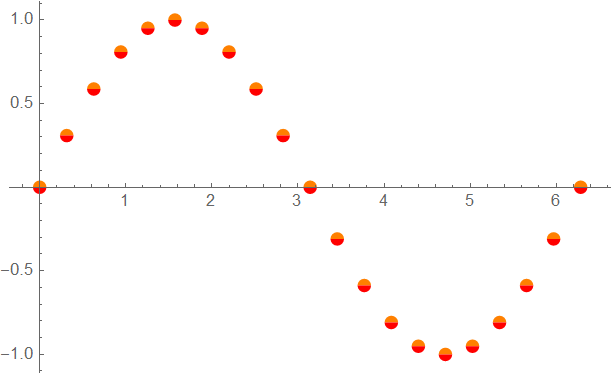
I have a very simple question. I'd like to display two points -- that currently appear on top of each other in a ListPlot -- as (replace them by) a single plot marker with two colours, one for each half of the marker, say upper/lower halves. Since I am using the default plot markers, I'm just after a disk of precisely the same size as the one from PlotMarkers -> Automatic with adjustable colours for the upper and lower halves. Then I can easily match the size and colours with the rest of my plot. How does one make this marker?
Here's a toy example to play around with:
ListPlot[{Table[1/n,{n,10}],ConstantArray[1/10,10]}]. In this case I'd like the last point to have the first default colour (upper half) and second default colour (lower half).


Showand add the point on top at the end. So it's just the marker that I need. But that's already a lot of work? In general I'd like the shapes and sizes of the markers of the two data series (containing the overlapping point) to be the same $\endgroup$PolygonMarkersresource function. The "neat examples" section contains an example of half-filled polygonal markers. $\endgroup$PolygonMarkerlooks promising, thanks for the pointer! $\endgroup$