3
$\begingroup$

I have a very simple question. I'd like to display two points -- that currently appear on top of each other in a ListPlot -- as (replace them by) a single plot marker with two colours, one for each half of the marker, say upper/lower halves. Since I am using the default plot markers, I'm just after a disk of precisely the same size as the one from PlotMarkers -> Automatic with adjustable colours for the upper and lower halves. Then I can easily match the size and colours with the rest of my plot. How does one make this marker?

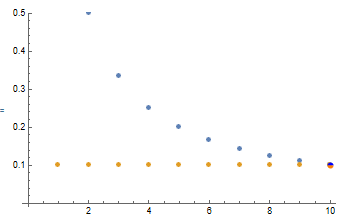
Here's a toy example to play around with: ListPlot[{Table[1/n,{n,10}],ConstantArray[1/10,10]}]. In this case I'd like the last point to have the first default colour (upper half) and second default colour (lower half).

$\endgroup$
4
  • 1
    $\begingroup$ I noticed that any questions that start with "I have a simple question" are very rarely simple :-) That will require a lot of manual fiddling. Are you sure you can't change the size of one of the two data series so the underlying one still shows, or some other presentation change that can work within the existing framework? Can you include some sample data to play with? $\endgroup$
    – MarcoB
    Commented Sep 18, 2023 at 15:47
  • $\begingroup$ I thought I can just use e.g. Show and add the point on top at the end. So it's just the marker that I need. But that's already a lot of work? In general I'd like the shapes and sizes of the markers of the two data series (containing the overlapping point) to be the same $\endgroup$ Commented Sep 18, 2023 at 15:50
  • 1
    $\begingroup$ Perhaps look at the PolygonMarkers resource function. The "neat examples" section contains an example of half-filled polygonal markers. $\endgroup$
    – MarcoB
    Commented Sep 18, 2023 at 15:59
  • $\begingroup$ @MarcoB Added a simple example. Ooh, PolygonMarker looks promising, thanks for the pointer! $\endgroup$ Commented Sep 18, 2023 at 16:08

3 Answers 3

2
$\begingroup$

You may draw a marker consisting of 2 half disks with the corresponding colors:

ListPlot[{Table[1/n, {n, 10}], ConstantArray[1/10, 10]}, 
 Epilog -> {Blue, Disk[{10, 0.1}, {0.1, 0.008}, {0, Pi}], Orange, , 
   Disk[{10, 0.1}, {0.1, 0.008}, {Pi, 2 Pi}]}]

enter image description here

$\endgroup$
4
  • $\begingroup$ That's quite decent. Actually just the Epilog -> {Blue, Disk[{10, 0.1}, {0.065, 0.005}, {0, Pi}] would more or less work, except that I had to fiddle around to get the size approximately right. Is there an easy way to get the dimension to match that of (half) the default plotmarker? $\endgroup$ Commented Sep 18, 2023 at 16:41
  • $\begingroup$ You could take a fraction of the PlotRange. $\endgroup$ Commented Sep 18, 2023 at 17:20
  • 1
    $\begingroup$ And do you happen to know what the default fraction of the PlotRange is? $\endgroup$ Commented Sep 18, 2023 at 19:33
  • $\begingroup$ Look at may plot. I used 0.1 in the x direction. This is 1/100. $\endgroup$ Commented Sep 19, 2023 at 6:52
3
$\begingroup$

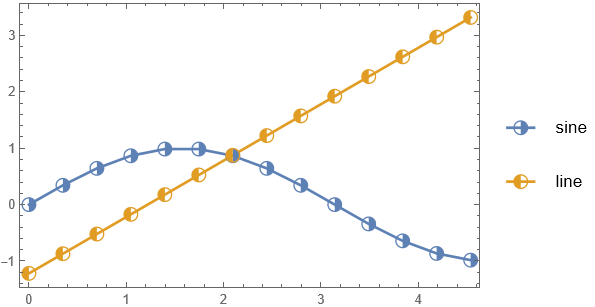
Here's an attempt using the PolygonMarkers resource function. The hfm function is adapted from the Neat Examples section of the documentation of that resource function.

sin = Table[{x, Sin[x]}, {x, 0, 1.5 Pi, Pi/9}];
line = Table[{x, x - 1.22}, {x, 0, 1.5 Pi, Pi/9}];

ClearAll[hfm]
hfm[name_String, side_String : "Right", size_ : 9] :=
 Module[
  {checkSide = If[side === "Right", Negative, Positive, Negative]},
  Show[
   ResourceFunction["PolygonMarker"][name, Offset@size, {FaceForm[None], Dynamic@EdgeForm[{CurrentValue["Color"], AbsoluteThickness[1], Opacity[1]}]}],
   ResourceFunction["PolygonMarker"][name, Offset@size, EdgeForm[None]] /. {x_?checkSide, y_?NumericQ} :> {0, y}
   ]
  ]

ListPlot[
 {sin, line},
 PlotMarkers -> {hfm["Circle", "Right"], hfm["Circle", "Left"]},
 Joined -> True,
 Frame -> True, Axes -> False,
 PlotLegends -> PointLegend[{"sine", "line"}, LegendMarkerSize -> {40, 30}]
]

sample plot with an intersecting point with half-filled markers

$\endgroup$
1
  • $\begingroup$ That's pretty good already! I'd like to keep the default markers everywhere except at the overlapping point, where want to superimpose the new extra marker showing both colours (and EdgeForm[Empty]). $\endgroup$ Commented Sep 18, 2023 at 16:36
3
$\begingroup$

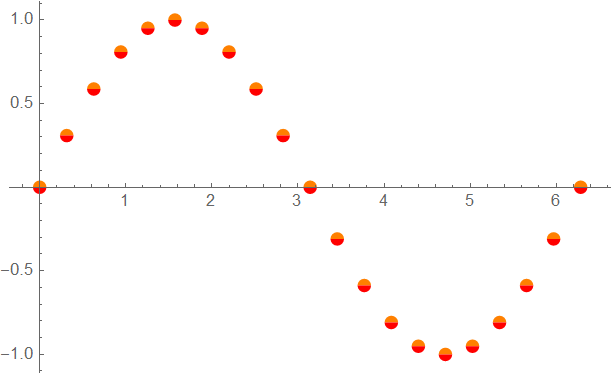
A possibility could be:

t = Table[{x, Sin[x]}, {x, 0, 2 π, π/10}];
m1 = Graphics[{
    Orange, Disk[{0, 0}, Offset[{4, 4}], {0, \[Pi]}]
    }
   , PlotRangePadding -> Scaled[.05]
   ];

m2 = Graphics[{
    Red, Disk[{0, -1}, Offset[{4, 4}], {\[Pi], 2 \[Pi]}]
    }
   , PlotRangePadding -> Scaled[.05]
   ];

ListPlot[{t, t}, PlotMarkers -> {m1, m2}, 
 PlotRangePadding -> Scaled[.05]]

enter image description here

$\endgroup$
3
  • $\begingroup$ Thanks for the quick reply! It's certainly in the right direction, but somehow it looks like the red part is slightly wider (horizontally), takes up a bit more than half of the marker (vertically), and misses a bit at the bottom. $\endgroup$ Commented Sep 18, 2023 at 16:06
  • $\begingroup$ I have updated the answer. $\endgroup$
    – Syed
    Commented Sep 18, 2023 at 16:25
  • 3
    $\begingroup$ I think that if intersections is all you want to show, then create a multicolor disk and use it in the Epilog. $\endgroup$
    – Syed
    Commented Sep 18, 2023 at 16:39

Your Answer

By clicking “Post Your Answer”, you agree to our terms of service and acknowledge you have read our privacy policy.

Not the answer you're looking for? Browse other questions tagged or ask your own question.