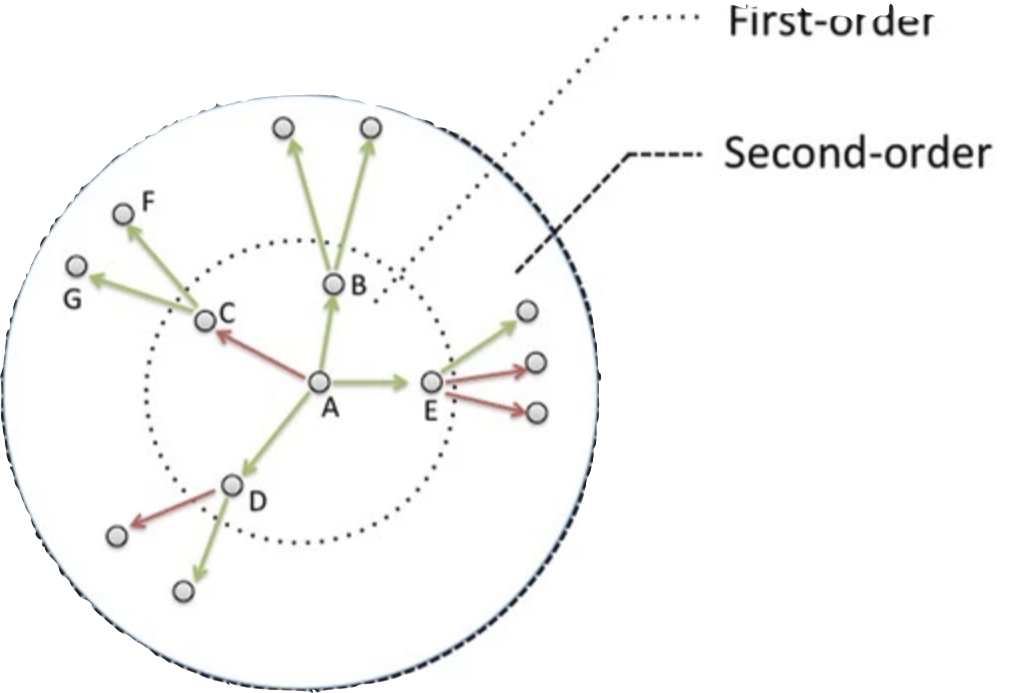
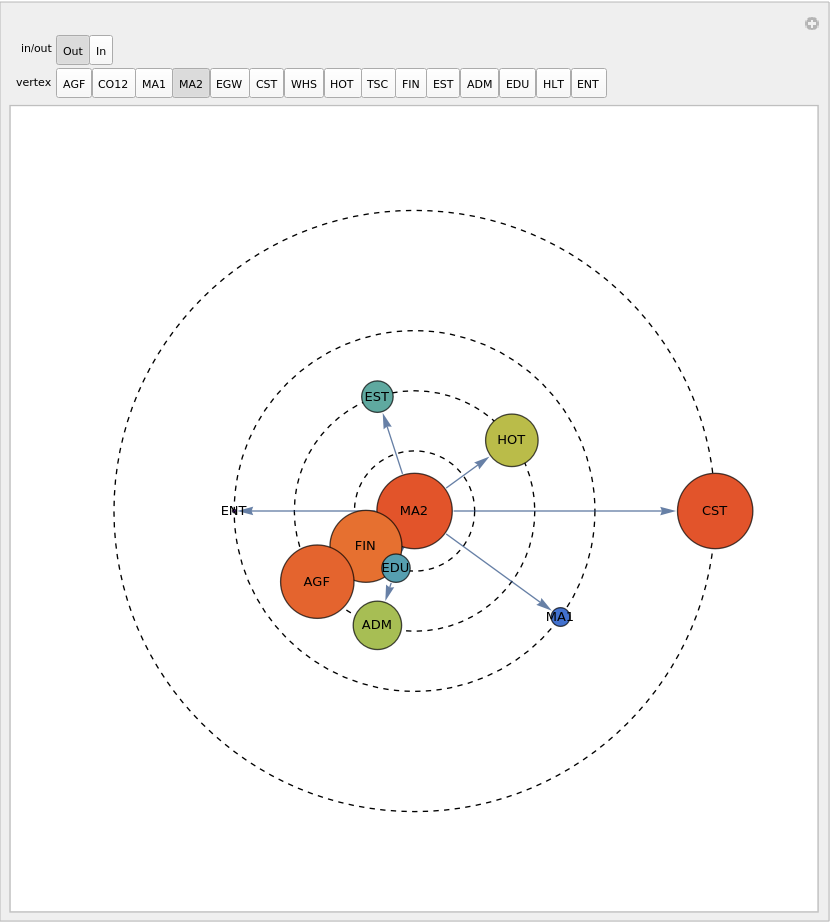
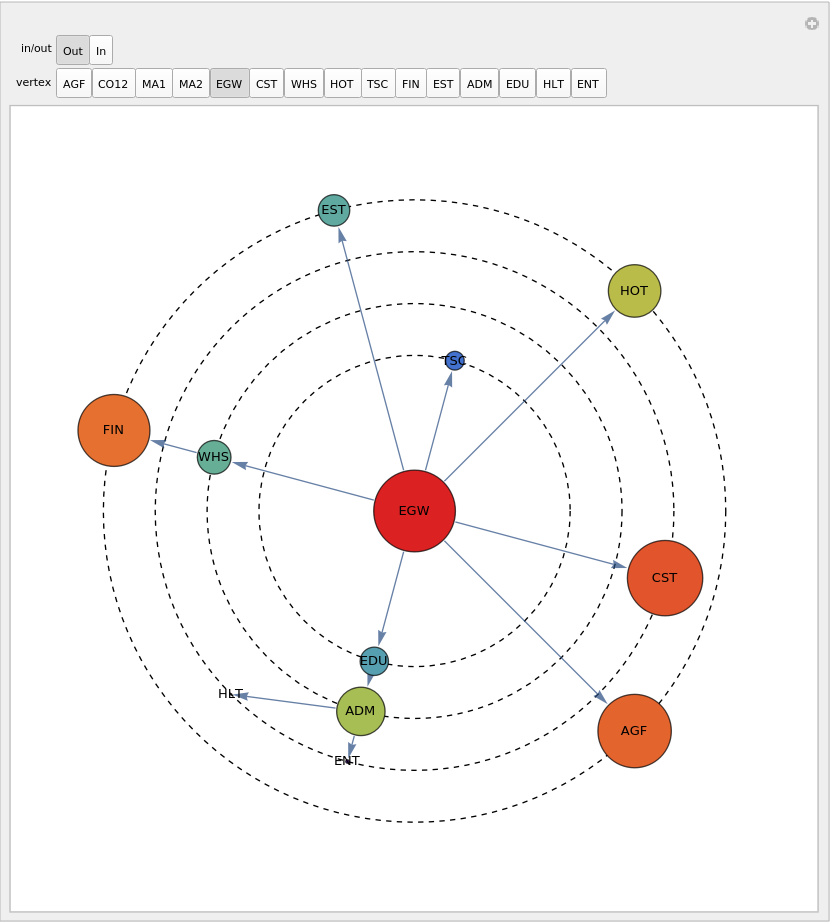
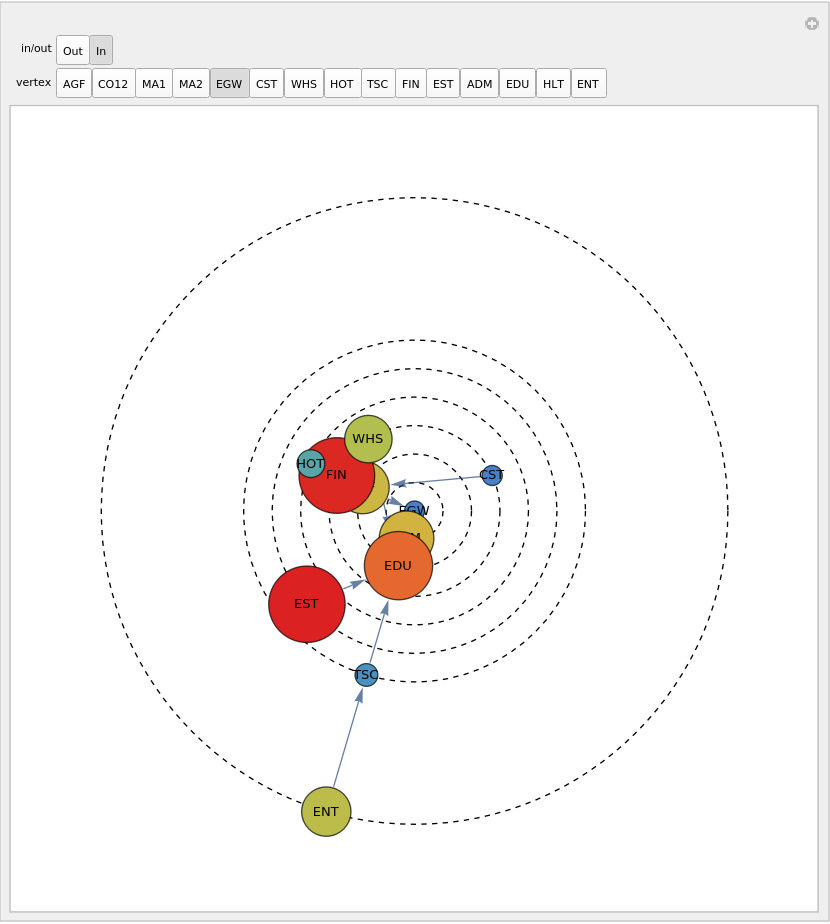
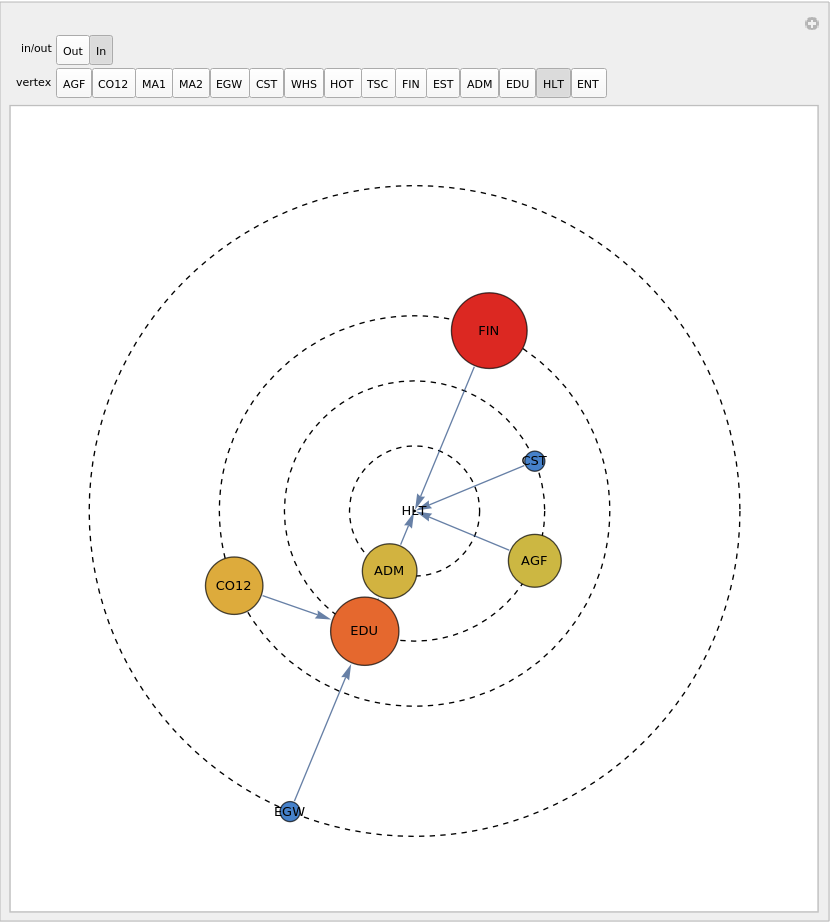
This code works and delivers NeighborhooGraph[.] of a chosen vertex. The resulting graph is bit difficult to understand and therefore I like represent the same graph on a 2D circles as shown in the figure below. The first circle should include those out-going edges from the selected vertex, say 4. It must exclude incoming edges because I will generate the same 2D figure using incoming edges separately.
My question is: How can I generate the 2D-circle plot using (1) only those out-going edges from the vertex chosen, and (2) how can separately generate the same plot using in-coming edges. Parallel edges between the neighbors of the selected vertex should remain as they are neither upward or downward.
Using Manipulate[.] seems to be necessary to answer this question, with the neighborhood controller k. Basically, Manipulate should have four controls: In, Out, neighborhood distance k, selected vertex sv.
ClearAll[wam, vLabels, sa, wag, evc, g];

(* convert the matrix into a directed graph *)
wam = {{0, 0.03, 0, 0.03, 0.02, 0.0, 0.02, 0, 0.01, 0.01, 0.02, 0.0,
0.01, 0.02, 0.02}, {0.05, 0, 0.07, 0, 0, 0, 0.03, 0.0, 0, 0.01,
0.06, 0.0, 0.01, 0.04, 0.0}, {0, 0, 0, 0, 0, 0, 0, 0, 0, 0.06, 0,
0, 0.07, 0, 0}, {0.05, 0, 0.03, 0, 0.0, 0.05, 0.0, 0.02, 0, 0.01,
0.02, 0.03, 0.01, 0.0, 0.03}, {0.06, 0, 0, 0, 0, 0.05, 0.04, 0.06,
 0.03, 0.08, 0.06, 0.05, 0.03, 0.07, 0.06}, {0.01, 0.02, 0.0,
0.03, 0.0, 0, 0.02, 0.01, 0.0, 0.01, 0.0, 0.05, 0.0, 0.02,
0.0}, {0, 0, 0, 0, 0, 0, 0, 0, 0, 0.02, 0.06, 0.06, 0.01, 0,
0}, {0, 0.05, 0.0, 0.06, 0.0, 0.0, 0.09, 0, 0.0, 0.01, 0.0, 0.07,
0, 0.0, 0.02}, {0, 0, 0, 0, 0, 0, 0, 0, 0, 0.07, 0, 0, 0.04, 0,
0}, {0.01, 0.07, 0.03, 0.04, 0, 0.0, 0.05, 0.08, 0.0, 0, 0.03,
0.02, 0.0, 0.03, 0.09}, {0.04, 0.07, 0.05, 0, 0, 0, 0, 0, 0, 0, 0,
 0, 0.03, 0, 0}, {0, 0.01, 0.06, 0, 0.01, 0.07, 0.0, 0.0, 0.0,
0.0, 0.08, 0, 0, 0.01, 0.01}, {0, 0, 0, 0, 0, 0, 0, 0, 0, 0.05,
0.05, 0.01, 0, 0.06, 0}, {0, 0, 0, 0, 0, 0, 0, 0, 0, 0, 0, 0, 0,
0, 0}, {0, 0, 0, 0, 0, 0, 0, 0, 0.05, 0, 0, 0, 0, 0, 0}};
vLabels = {1 -> AGF, 2 -> CO12, 3 -> MA1, 4 -> MA2, 5 -> EGW,
6 -> CST, 7 -> WHS, 8 -> HOT, 9 -> TSC, 10 -> FIN, 11 -> EST,
12 -> ADM, 13 -> EDU, 14 -> HLT, 15 -> ENT};
sa = SparseArray[wam];
wag = Graph[sa["NonzeroPositions"], EdgeWeight -> sa["NonzeroValues"],
DirectedEdges -> True, EdgeLabels -> "EdgeWeight"];

(* compute some statistics *)
evc = EigenvectorCentrality[wag] /. vLabels;

g = Graph[
sa["NonzeroPositions"],
VertexSize -> {v_ :> ({#, #} &@Normalize[evc, Total][[v]])},
PerformanceGoal ->
"Quality",(*so that arrow heads are not covered by vertex disks*)
ImagePadding ->
10,                      (*so that vertex labels are not clipped*)
EdgeWeight -> sa["NonzeroValues"],
DirectedEdges -> True,
VertexLabels -> vLabels
];

HighlightGraph[g, NeighborhoodGraph[g, 4]]

