4
$\begingroup$

I have the following code plotting community structure of random graph g. As one can see, the community structure plot presents a nice visual impact. I like to generate a similar plot for the connected components of g using ConnectedComponents[g]. HighLightGraph is showing individual vertices in a given component with the same color but this kind of presentation is not so useful for my purpose. I like to see the components linked to each other through binary links between the components.

SeedRandom[4];
g = RandomGraph[{30, 50}, DirectedEdges -> True];
gg = ConnectedComponents[g];
CommunityGraphPlot[g, CommunityRegionStyle -> LightGray, 
Method -> "Centrality"];
HighlightGraph[g, Subgraph[g, #] & /@ gg];

Thanks.

$\endgroup$
2
  • 1
    $\begingroup$ does CommunityGraphPlot[g, gg, CommunityRegionStyle -> LightGray, Method -> "Centrality"] give what you need? $\endgroup$
    – kglr
    Commented Jul 17, 2019 at 4:19
  • 1
    $\begingroup$ @kglr: Yes, it gives what I want to see. In fact, your solution provides answers to several of my problems. Thank you very much... $\endgroup$ Commented Jul 17, 2019 at 4:27

1 Answer 1

6
$\begingroup$

You can use the second argument of CommunityGraphPlot to specify any community structure (not necessarily a partition of the vertex set).

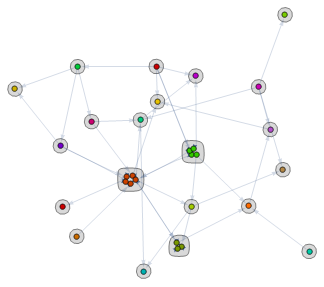
Using gg as the community structure

CommunityGraphPlot[g, gg, CommunityRegionStyle -> LightGray]

enter image description here

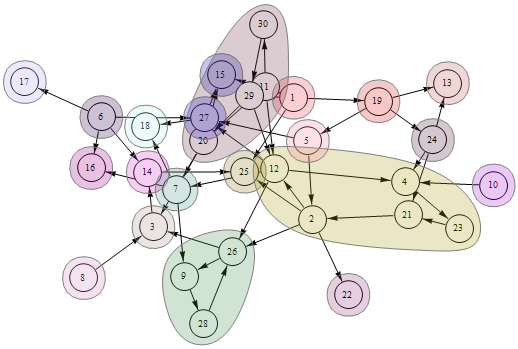
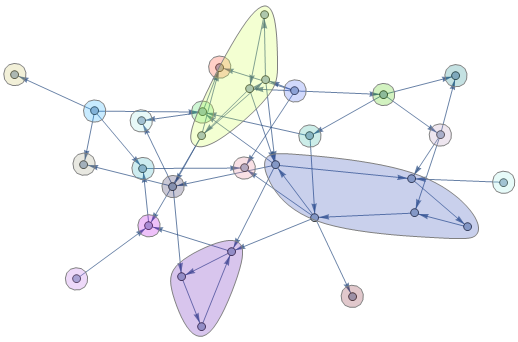
If you want to retain the layout of the original graph, you can use the function blobF from this answer to highlight groups of vertices with blobs:

SetProperty[g, {PlotTheme->"IndexLabeled", ImageSize -> Large,
  Epilog -> blobF[g, RandomColor[Length@gg],gg, .1] }]

enter image description here

SetProperty[g, {ImageSize -> Large, Epilog -> blobF[g, RandomColor[Length@gg], gg, .05] }]

enter image description here

$\endgroup$
8
  • $\begingroup$ I am having trouble with SelfLoops. In my graph, there are many self loops which I do not want to see. How can you drop them out of the final graph view? $\endgroup$ Commented Jul 18, 2019 at 3:33
  • 1
    $\begingroup$ @Tugrul, does SimpleGraph@g help? $\endgroup$
    – kglr
    Commented Jul 18, 2019 at 3:37
  • $\begingroup$ It works for adjacency matrix, though vertex names are removed, which I do not want.I have been struggling with this problem for a long time. When I plot a graph using SimpleGraph it drops the vertex names. I also tried SelfLoopStyle and SelfLoops but no success. I have a weighted directed graph with vertex names. I simply like to keep the integrity of the graph but when plotting it I do not want to see the selfloops with vertex names kept. $\endgroup$ Commented Jul 18, 2019 at 6:55
  • 1
    $\begingroup$ I was writing a new question but in the meantime I discovered an answer to my question about SelfLoops. Here is the code: SeedRandom[1]; am = RandomInteger[{0, 1}, {10, 10}]; ag = AdjacencyGraph[am, VertexLabels -> "Name"]; vLabels = {1 -> AGR, 2 -> FIS, 3 -> CO1, 4 -> CO2, 5 -> MA1, 6 -> MA2, 7 -> EGW, 8 -> CST, 9 -> WHS, 10 -> HOT}; SimpleGraph[ag, VertexLabels -> vLabels] $\endgroup$ Commented Jul 18, 2019 at 7:33
  • 1
    $\begingroup$ With version 12 updates, SimpleGraph works fine (it retains vertex names, edgeweights...) so if your adjacency graph has named vertices, that is, if you define it as ag2 = AdjacencyGraph[Values @ vLabels, am], then sg = SimpleGraph[ag2] retains vertex names: VertexList[sg] == VertexList[ag2] is True. $\endgroup$
    – kglr
    Commented Jul 18, 2019 at 7:54

Your Answer

By clicking “Post Your Answer”, you agree to our terms of service and acknowledge you have read our privacy policy.

Not the answer you're looking for? Browse other questions tagged or ask your own question.