3
$\begingroup$

I would like to give my ListPlot a more bar-like appearance like seen in this question:

How to include vertical lines in DiscretePlot?

I tried:

ListPlot[{1, 2, 3, 6, 4, 4},
   Filling -> {1 -> Bottom},
   FillingStyle -> Directive[Thickness[0.06], CapForm["Butt"], EdgeForm[Black]],
   Frame -> True,
   GridLines -> Automatic,
   Method -> {"GridLinesInFront" -> False},
   PlotRangePadding -> {{-0.5, 0.5}, {0.5, 0.5}}]

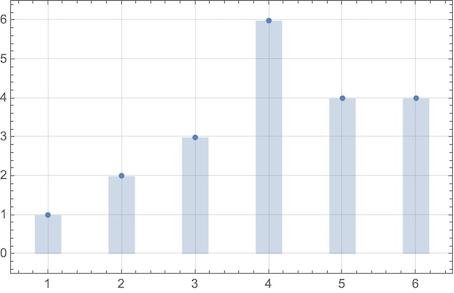
enter image description here

But obviously FillingStyle doesn't accept EdgeForm specifications.

Is there another way to surround the bars with a thin black line?

And a second question:

Is it possible to hide the GridLines behind the bars (overwrite GridLines with FillingStyle)?

$\endgroup$
5
  • $\begingroup$ See Graphics->Options->Methods in the docs for Method -> {"GridLinesInFront" -> True}. $\endgroup$
    – Syed
    Commented Aug 23, 2023 at 10:13
  • $\begingroup$ Thank you, I added this option, but it doesn't help $\endgroup$
    – eldo
    Commented Aug 23, 2023 at 11:25
  • $\begingroup$ Works for this toy example: ContourPlot[{Abs[Sin[x] Sin[y]] == 0.5, Abs[Cos[x] Cos[y]] == 0.5} , {x, 0, 4 Pi}, {y, 0, 4 Pi} , ContourStyle -> {{Thickness[0.02], Red}, {Thickness[0.02], Blue}} , GridLines -> Automatic , GridLinesStyle -> {{Gray, White}, {Gray, White}} , ContourShading -> Automatic , Method -> {"GridLinesInFront" -> True} ] and certainly deserves a separate question. $\endgroup$
    – Syed
    Commented Aug 23, 2023 at 11:51
  • 2
    $\begingroup$ FillingStyle does accept EdgeForm specifications, but they have no effect because the output from ListPlot has no polygons. The "filling" is made with Line primitives using an explicit Thickness setting. $\endgroup$
    – Jason B.
    Commented Aug 23, 2023 at 18:32
  • $\begingroup$ Similar to 31060. $\endgroup$
    – Syed
    Commented Aug 27, 2023 at 2:55

5 Answers 5

3
$\begingroup$
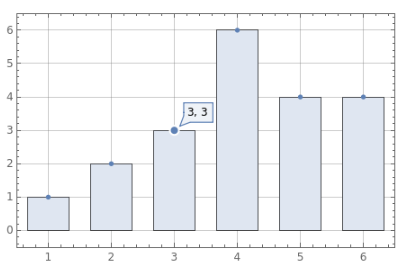
pts = {1, 2, 3, 6, 4, 4};

ListPlot[pts, Frame -> True, GridLines -> Automatic, 
 PlotRangePadding -> {{-0.5, 0.5}, {0.5, 0.5}}, 
 Prolog -> First @ BarChart[pts, 
    ChartStyle -> Blend[{White, ColorData[97][1]}, .2], Axes -> False,
    BarSpacing -> Large, PerformanceGoal -> "Speed"]]

enter image description here

$\endgroup$
1
  • 1
    $\begingroup$ Perfect - and I can even create combinations like ListPlot[{pts1, pts2}, Joined -> {False, True}, Prolog -> First@BarChart[pts1, ChartStyle -> "Pastel"]] $\endgroup$
    – eldo
    Commented Aug 24, 2023 at 6:06
5
$\begingroup$

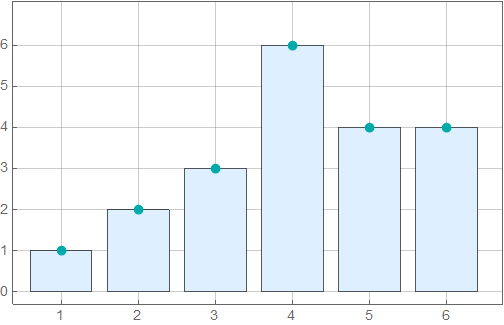
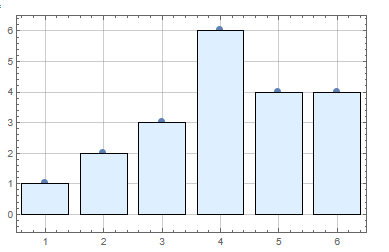
Your question is about ListPlot but the output is starting to resemble a BarChart. Can you perhaps use it in this particular instance?

pts = {1, 2, 3, 6, 4, 4};

BarChart[pts
 , ChartStyle -> {Directive[
    EdgeForm[{Black, Thin}], LightBlue]
   }
 , BarSpacing -> Medium
 , GridLines -> {Automatic, Automatic}
 , PlotRange -> {{0.5, 6.6}, {-0.3, 6.7}}
 , Frame -> True
 , FrameTicks -> {{Range[0, Max@pts], None}
   , {Range@Length@pts, None}
   }
 , Epilog -> {AbsolutePointSize@Large, Darker@Cyan
   , Point@Transpose[{Range@Length@#, #} &@pts]
   }
 ]

enter image description here

$\endgroup$
1
  • 1
    $\begingroup$ Thanks, in many cases I could use it, but in some cases I have to use ListPlot. +1 anyway $\endgroup$
    – eldo
    Commented Aug 23, 2023 at 9:44
5
$\begingroup$

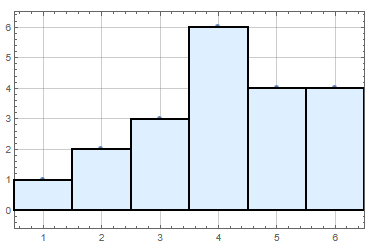
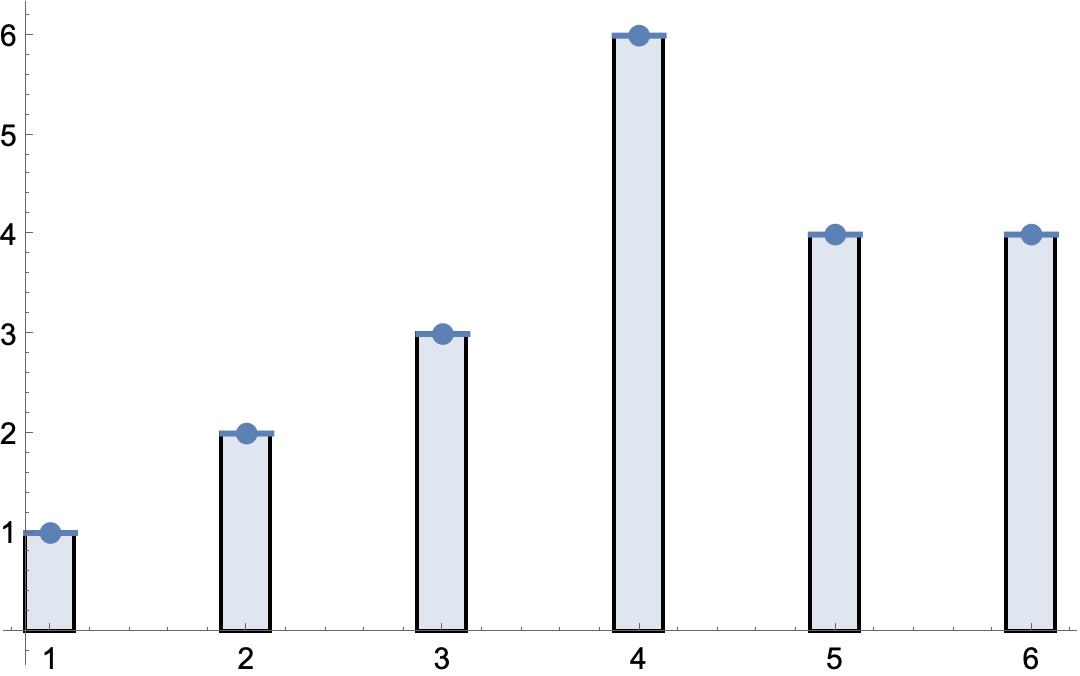
Something like:

c = 0;
pts = {1, 2, 3, 6, 4, 4};
ListPlot[pts,
 Frame -> True, GridLines -> Automatic, 
 PlotRangePadding -> {{-0.5, 0.5}, {0.5, 0.5}}, 
 Epilog -> {EdgeForm[{Thick}], LightBlue, 
   Rectangle[{++c - 0.5, 0}, {c + 0.5, #}] & /@ pts}, 
 PlotRange -> {{0, 6.01}, {-0.1, 6}}]

![enter image description here

Addendum

With different styling:

c = 0;
pts = {1, 2, 3, 6, 4, 4};
ListPlot[pts, Frame -> True, GridLines -> Automatic, 
 PlotRangePadding -> {{-0.5, 0.5}, {0.5, 0.5}}, 
 PlotStyle -> PointSize[Large], 
 Epilog -> {EdgeForm[{Thin}], LightBlue, 
   Rectangle[{++c - 0.4, 0}, {c + 0.4, #}] & /@ pts}, 
 PlotRange -> {{0, 6.01}, {-0.1, 6}}]

enter image description here

$\endgroup$
2
  • $\begingroup$ It would be near to perfect with the following changes: (1) Edgeform Thin instead of Thick, (2) Rectangle width of 0.4 to get spaces between the bars and (3) .../@ (pts - 0.1) inside Epilog to make the small points more visible. $\endgroup$
    – eldo
    Commented Aug 23, 2023 at 8:41
  • 1
    $\begingroup$ Done, but why you do not make such small changes yourself? $\endgroup$ Commented Aug 23, 2023 at 11:25
5
$\begingroup$
$Version

(* "13.3.1 for Mac OS X ARM (64-bit) (July 24, 2023)" *)

Clear["Global`*"]

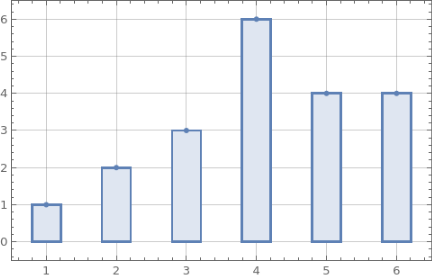
Or, given an answer for DiscretePlot, convert the ListPlot to a DiscretePlot.

DiscretePlot[{1, 2, 3, 6, 4, 4}[[n]], {n, Length@data},
 PlotMarkers -> Automatic,
 ExtentSize -> 0.25, BaseStyle -> EdgeForm[Thickness[Medium]]]

enter image description here

$\endgroup$
3
$\begingroup$
ClearAll[rectangleFilling]

rectangleFilling[w_ : 12, op_ : .8, ef_ : Automatic] := 
 ReplaceAll[
  GraphicsComplex[c_, p_] :> 
   GraphicsComplex[c, 
    p /. Line[{a_, b_}, ___] :> 
      Dynamic @ {Opacity[1], Blend[{CurrentValue["Color"], White}, op], 
        EdgeForm[{AbsoluteThickness[2], 
          ef /. Automatic -> CurrentValue["Color"]}], 
        Rectangle[Offset[{-w, 0}, c[[b]]], Offset[{w, 0}, c[[a]]]]}]]

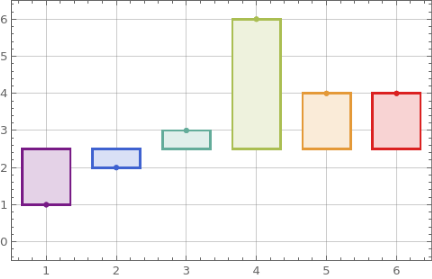
Examples:

rectangleFilling[]@
 ListPlot[{1, 2, 3, 6, 4, 4}, Filling -> Bottom, 
  FillingStyle -> Directive[CapForm["Butt"], AbsoluteThickness[5]], 
  Frame -> True, GridLines -> Automatic, 
  PlotRangePadding -> {{-0.5, 0.5}, {0.5, 0.5}}]

enter image description here

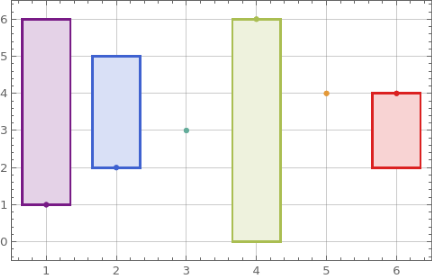
rectangleFilling[20]@
 ListPlot[MapIndexed[{{#2[[1]], #}} &]@{1, 2, 3, 6, 4, 4}, 
  PlotStyle -> "Rainbow", Filling -> 2.5, 
  FillingStyle -> Directive[CapForm["Butt"], AbsoluteThickness[5]], 
  Frame -> True, GridLines -> Automatic, 
  PlotRangePadding -> {{-0.5, 0.5}, {0.5, 0.5}}]

enter image description here

Replace Filling -> 2.5} above with Filling -> {1 -> Top, 2 -> 5, 4 -> Bottom, 6 -> 2}` to get

enter image description here

$\endgroup$

Your Answer

By clicking “Post Your Answer”, you agree to our terms of service and acknowledge you have read our privacy policy.

Not the answer you're looking for? Browse other questions tagged or ask your own question.