9
$\begingroup$

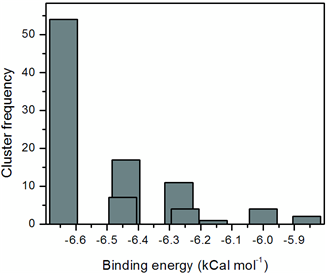
Can anyone help me please? I don't want a Histogram; I don't want a BarChart, not even a ListPlot with drop down lines. I want a list plot with drop down columns/bars: please see the link.

Mathematica graphics

It is basically a histogram but of a different kind. The data structure contains two variables for example in the above figure it was energy and standard deviation. And the frequency distribution was done based on two cut-offs {0.5,2.0} and finally it was plotted along the energy axis. Therefore, it contains overlapping bars/columns. A projection of a 3D histogram in two dimensions.

$\endgroup$
3
  • 4
    $\begingroup$ Please provide some data to work on :) $\endgroup$
    – Kuba
    Commented Aug 24, 2013 at 18:07
  • 2
    $\begingroup$ @Kuba blogs.citypages.com/ctg/lt%20cmdr%20data.jpg $\endgroup$ Commented Aug 24, 2013 at 18:15
  • $\begingroup$ @belisarius can't argue, it's something :) $\endgroup$
    – Kuba
    Commented Aug 24, 2013 at 18:27

2 Answers 2

15
$\begingroup$

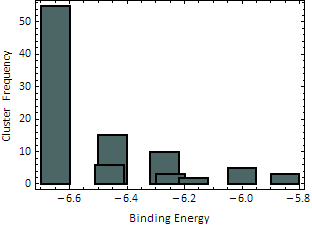
Why not just assemble the chart from rectangles?

data = {{-6.65, 55}, {-6.45, 15}, {-6.27, 10}, {-6, 5}, {-5.85, 3}, 
 {-6.46, 6}, {-6.25, 3}, {-6.17, 2}};

Graphics[{EdgeForm[{Thick, Black}], RGBColor[0.3, 0.4, 0.4], 
  Rectangle[{#1 - 0.05, 0}, {#1 + 0.05, #2}] & @@@ data},
 Frame -> True, AspectRatio -> 0.7, FrameLabel -> {"Binding Energy", "Cluster Frequency"}]

enter image description here

$\endgroup$
1
  • $\begingroup$ By falling back to create your own graphics, you loose all the layout/styling/annotation options of either BarChart or Histogram. BarChart however cannot overlay multiple datasets transparently as Histogram does (at least not directly). Histogram on the other hand cannot work with already computed bin list data. DiscretePlot does not (directly) work on list data. It seems like that a trivial method to overlay multiple datasets as bars does not exist as of 2018. $\endgroup$ Commented May 31, 2018 at 15:29
11
$\begingroup$

BarChart

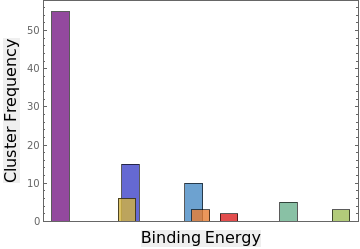
Although OP says "I don't want a BarChart", the requirements of list plot with drop down columns/bars (overlapping bars/columns) can be achieved using BarChart with a simple ChartElementFunction that produces the desired rectangles for each data point:

ClearAll[ceF]
ceF[w_: .1, df_:"Rectangle"] := ChartElementData[df][{#3[[1]] + {-w, w}/2, #[[2]]}, ##2]&

Examples:

Using @SimonWoods' example data and options:

data = {{-6.65, 55}, {-6.45, 15}, {-6.27, 10}, {-6, 5}, {-5.85, 3}, 
 {-6.46, 6}, {-6.25, 3}, {-6.17, 2}};

Pre-rocess data to use bin centers as metadata for bin heights:

barchartdata = Rule @@@ (Reverse /@ data);
minmax = Through[{Min, Max}@data[[All, 1]]];

w = .1;
BarChart[barchartdata, ChartElementFunction -> ceF[w], 
   ChartBaseStyle -> Opacity[.8], ChartStyle -> "Rainbow",  
   PlotRange -> {minmax + {-w, w}, All}, Axes -> False, Frame -> True, 
   AspectRatio -> 0.7, FrameLabel -> (Style[#, 16, "Panel"] & /@ 
  {"Binding Energy", "Cluster Frequency"})] /. Line[__] :> Sequence[]
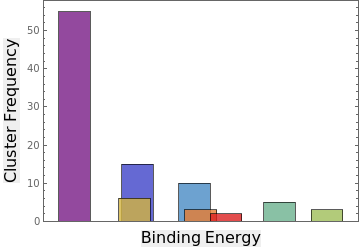
enter image description here

Using w = .05:

enter image description here

Using a different built-in ChartElementFunction as input, i.e., with ChartElementFunction -> ceF[w, "FadingRectangle"]:
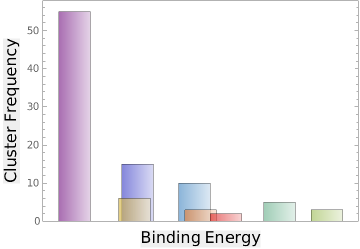
enter image description here

DiscretePlot

Define a simple function using data and plot it using DiscretePlot with your desired setting for the option ExtentSize to control bar widths.

ClearAll[dF]
Table[dF[d[[1]]] = d[[2]], {d, data}];

Examples:

w = .1;
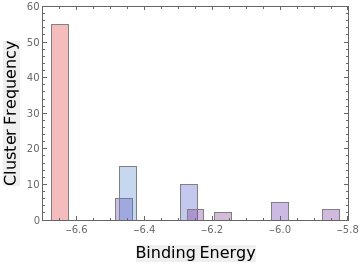
DiscretePlot[dF[i], {i, data[[All, 1]]}, Frame -> True, 
 Axes -> False, PlotRange -> {minmax + {-w, w}, {0, 60}}, 
 ExtentSize -> w, ColorFunction -> "Rainbow", 
 FillingStyle -> Directive[EdgeForm[Gray], Opacity[.3]],
 PlotStyle -> Opacity[0], AspectRatio -> 0.7, 
 FrameLabel -> (Style[#, 16, "Panel"] & /@ {"Binding Energy", "Cluster Frequency"})]
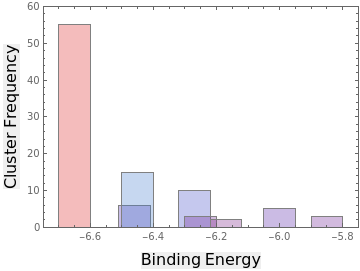
enter image description here

Use w = .05 to get

enter image description here

ListPlot

You can also post-process ListPlot output to change Points into Rectangles.

ClearAll[pntToRect]
pntToRect[w_: .1] := # /. Point -> (Rectangle[{#1 - w/2, 0}, {#1 + w/2, #2}] & @@@ # &)&

Example:

pntToRect[]@
 ListPlot[List /@ data, PlotStyle -> "Pastel", BaseStyle -> EdgeForm[Gray], 
  PlotRange -> {minmax + {-.1, .1}, {0, 60}}, Frame -> True, 
  Axes -> False, AspectRatio -> 0.7, 
  FrameLabel -> (Style[#, 16, "Panel"] & /@ {"Binding Energy", "Cluster Frequency"})]
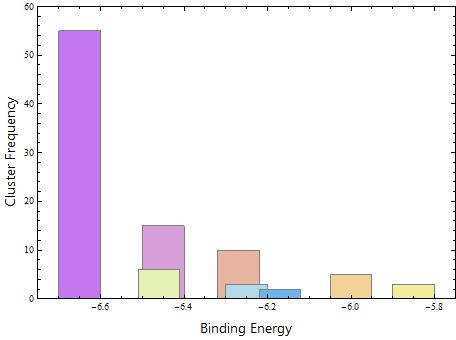
enter image description here

$\endgroup$
2
  • 1
    $\begingroup$ I think ceF should be ceFunc? Also, the DiscretePlot example doesn't seem to work properly at least in v12.3.1. $\endgroup$
    – xzczd
    Commented Sep 4, 2021 at 1:44
  • $\begingroup$ Thank you @xzczd for catching the errors. Both are fixed now. $\endgroup$
    – kglr
    Commented Sep 4, 2021 at 12:58

Your Answer

By clicking “Post Your Answer”, you agree to our terms of service and acknowledge you have read our privacy policy.

Not the answer you're looking for? Browse other questions tagged or ask your own question.