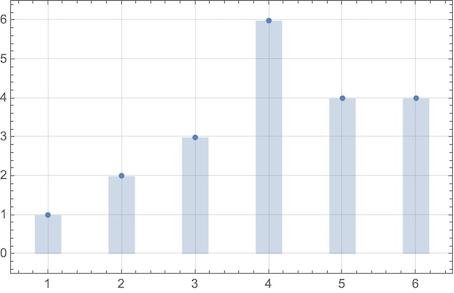
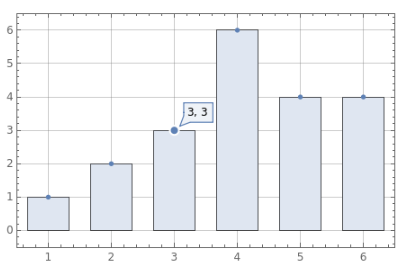
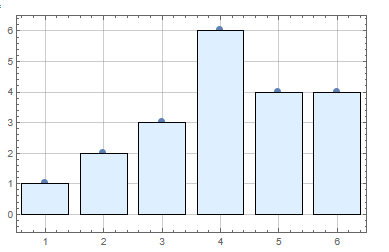
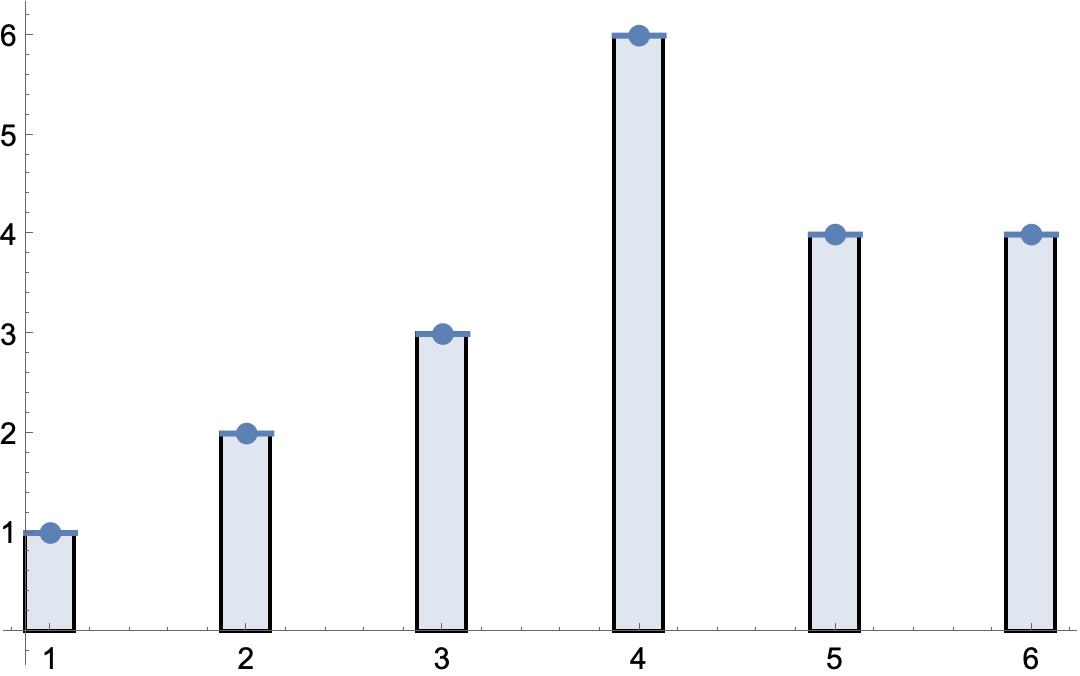
I would like to give my ListPlot a more bar-like appearance like seen in this question:
How to include vertical lines in DiscretePlot?
I tried:
ListPlot[{1, 2, 3, 6, 4, 4},
   Filling -> {1 -> Bottom},
   FillingStyle -> Directive[Thickness[0.06], CapForm["Butt"], EdgeForm[Black]],
   Frame -> True,
   GridLines -> Automatic,
   Method -> {"GridLinesInFront" -> False},
   PlotRangePadding -> {{-0.5, 0.5}, {0.5, 0.5}}]
But obviously FillingStyle doesn't accept EdgeForm specifications.
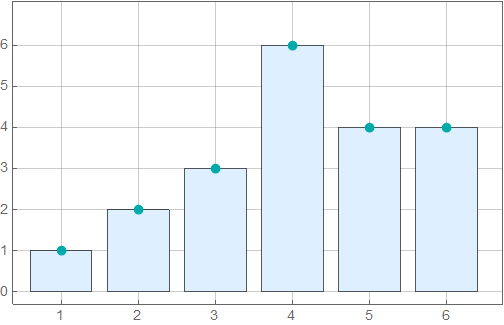
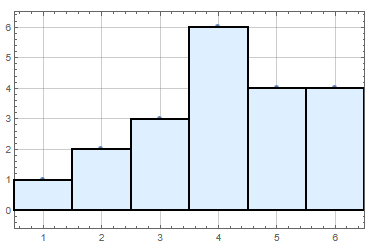
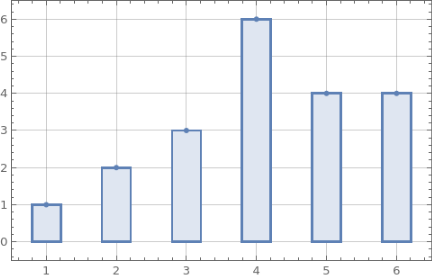
Is there another way to surround the bars with a thin black line?
And a second question:
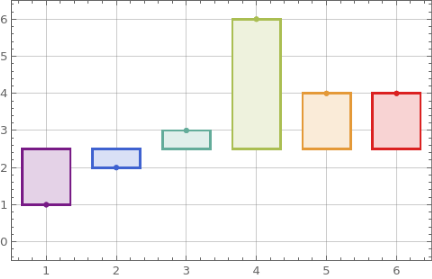
Is it possible to hide the GridLines behind the bars (overwrite GridLines with FillingStyle)?

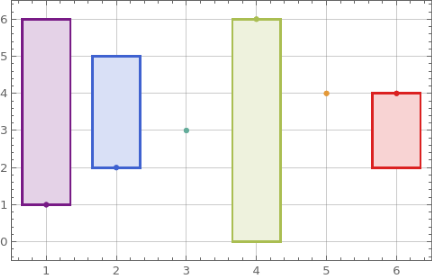
Graphics->Options->Methodsin the docs forMethod -> {"GridLinesInFront" -> True}. $\endgroup$ContourPlot[{Abs[Sin[x] Sin[y]] == 0.5, Abs[Cos[x] Cos[y]] == 0.5} , {x, 0, 4 Pi}, {y, 0, 4 Pi} , ContourStyle -> {{Thickness[0.02], Red}, {Thickness[0.02], Blue}} , GridLines -> Automatic , GridLinesStyle -> {{Gray, White}, {Gray, White}} , ContourShading -> Automatic , Method -> {"GridLinesInFront" -> True} ]and certainly deserves a separate question. $\endgroup$EdgeFormspecifications, but they have no effect because the output fromListPlothas no polygons. The "filling" is made withLineprimitives using an explicitThicknesssetting. $\endgroup$