1
$\begingroup$

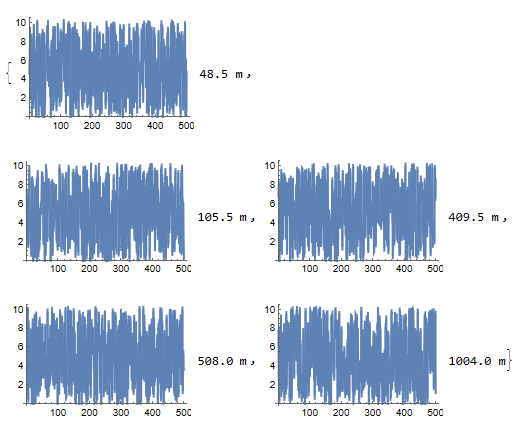
I want to change the plot legend in each panel while mapping a plot command. e.g., in the example below

ListLinePlot[#,
   PlotLegends -> 
    Placed[{"48.5 m", "105.5 m", "409.5 m", "508.0 m", "1004.0 m"}, 
     Right]
   ] & /@ RandomReal[10, {5, 500}]

I get

enter image description here

While I want the legends to be 48.5 m, 105.5 m, ....

$\endgroup$

2 Answers 2

5
$\begingroup$

Using MapThread:

dist = {"48.5 m", "105.5 m", "409.5 m", "508.0 m", "1004.0 m"};
data = RandomReal[10, {5, 500}];

MapThread[
 ListLinePlot[#1
   , PlotLegends -> Placed[{#2}, Right]
   ] &, {data, dist}]
$\endgroup$
2
$\begingroup$

You are feeding ListLinePlot always the same legend data. You must feed it different legends for each plot. You may achieve this e.g. using MapThread like:

MapThread[
 ListLinePlot[#1, PlotLegends -> Placed[#2, Right]] &, {RandomReal[
   10, {5, 500}], {"48.5 m", "105.5 m", "409.5 m", "508.0 m", 
   "1004.0 m"}}]

enter image description here

$\endgroup$

Your Answer

By clicking “Post Your Answer”, you agree to our terms of service and acknowledge you have read our privacy policy.

Not the answer you're looking for? Browse other questions tagged or ask your own question.