6
$\begingroup$

As the title indicates, I want to change the current position of the legends in a combined plot. The Mathematica code I used is

dataRG00 = {{2.5, 15.15}, {2.75, 13.73}, {3, 12.64}, {3.25, 
11.56}, {3.5, 10.68}, {3.75, 9.65}, {4, 9.31}, {4.25, 9.27}, {4.5,
 8.88}, {4.75, 8.21}, {5, 8.0}};
dataRG11 = {{2.5, 2.07}, {2.75, 3.0}, {3, 3.84}, {3.25, 4.58}, {3.5, 
5.56}, {3.75, 6.32}, {4, 6.73}, {4.25, 7.10}, {4.5, 7.06}, {4.75, 
7.07}, {5, 7.29}};
dataRG21 = {{2.5, 20.56}, {2.75, 19.50}, {3, 18.51}, {3.25, 
17.51}, {3.5, 16.52}, {3.75, 15.63}, {4, 14.75}, {4.25, 
13.85}, {4.5, 13.00}, {4.75, 12.26}, {5, 11.6}};
dataRG32 = {{2.5, 5.24}, {2.75, 5.14}, {3, 5.00}, {3.25, 4.51}, {3.5, 
4.25}, {3.75, 3.62}, {4, 2.56}, {4.25, 1.66}, {4.5, 1.42}, {4.75, 
1.29}, {5, 1.25}};
dataRG43 = {{2.5, 10.31}, {2.75, 10.41}, {3, 10.56}, {3.25, 
10.46}, {3.5, 10.25}, {3.75, 10.33}, {4, 10.67}, {4.25, 
10.23}, {4.5, 9.21}, {4.75, 9.60}, {5, 10.5}};
dataRG85 = {{2.5, 4.62}, {2.75, 4.64}, {3, 4.72}, {3.25, 4.67}, {3.5, 
4.46}, {3.75, 4.49}, {4, 4.37}, {4.25, 4.22}, {4.5, 4.25}, {4.75, 
4.06}, {5, 3.8}};
dataRG99 = {{2.5, 1.05}, {2.75, 0.77}, {3, 0.66}, {3.25, 0.74}, {3.5, 
0.86}, {3.75, 0.81}, {4, 0.90}, {4.25, 0.76}, {4.5, 0.90}, {4.75, 
0.90}, {5, 1.08}};
dataCH = {{2.5, 41.0}, {2.75, 42.81}, {3, 44.05}, {3.25, 45.96}, {3.5,
 47.42}, {3.75, 49.18}, {4, 50.68}, {4.25, 52.90}, {4.5, 
55.27}, {4.75, 56.60}, {5, 56.48}};

col = {Darker[Green], Red, Blue, Yellow, Orange, Cyan, Magenta, 
Darker[Gray]};
ley = {"Box", "1:1 linear", "2:1 boxlet", "3:2 boxlet", "4:3 boxlet", 
"8:5 boxlet", "Other resonances", "Chaotic"};
plrange = {{2.4, 5.1}, {-2, 60}};

legendPlot[xl_List] := 
ListPlot[xl, Frame -> True, 
PlotStyle -> Table[{Thickness[0.003], col[[i]]}, {i, 1, 8}], 
Joined -> True, PlotMarkers -> {Automatic, 15}, 
FrameLabel -> {"α", "Percentage %"}, 
FrameStyle -> Directive[FontSize -> 17, FontFamily -> "Helvetica"], 
PlotRange -> plrange, Axes -> False, ImageSize -> 600, 
Epilog -> 
 Inset[Grid[
 MapIndexed[{Graphics[{col[[First[#2]]], 
      Inset[Style[{\[FilledCircle], \[FilledSquare], \
 \[FilledDiamond], \[FilledUpTriangle], \[FilledDownTriangle], \
 \[EmptyCircle], \[EmptySquare], \[EmptyDiamond]}[[First[#2]]], 15]], 
      Thickness[0.08], Line[{{0, 0}, {1, 0}}]}, 
     AspectRatio -> 0.5, ImageSize -> 20], 
    Style[ley[[First[#2]]], Bold, FontSize -> 10, 
     FontFamily -> "Helvetica"]} &, xl]], 
Offset[{-2, -2}, Scaled[{1, 1}]], {Right, Top}]]

P0 = legendPlot[{dataRG00, dataRG11, dataRG21, dataRG32, dataRG43, 
dataRG85, dataRG99, dataCH}]

which produces the following plot
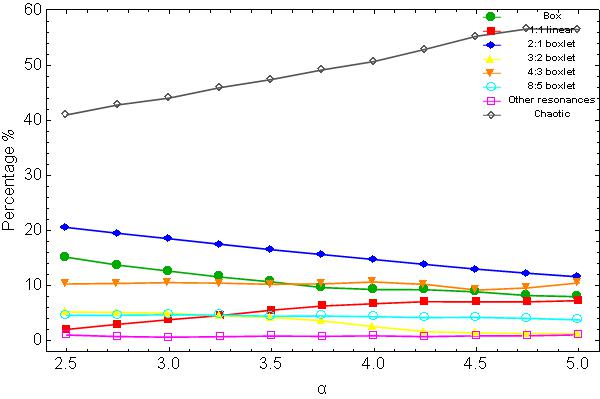
enter image description here

Obviously, the position of the legends is wrong since they overlap part of the plot. What I want, is to move the legends outside the frame of the plot and particularly at the right hand side of it and adjust it at the middle of the y range. I "played" a lot with Offset and Scaled but I without success.

Any ideas?

$\endgroup$
1
  • $\begingroup$ Have you tried PlotLegend? $\endgroup$
    – darksky
    Commented Apr 4, 2013 at 9:53

4 Answers 4

4
$\begingroup$
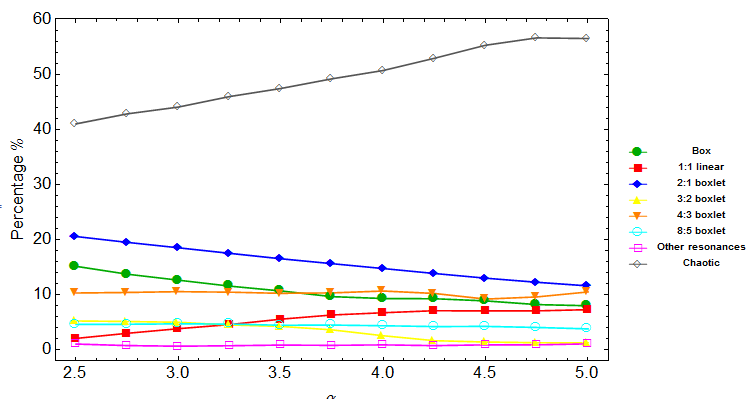
With[{xl = {dataRG00, dataRG11, dataRG21, dataRG32, dataRG43, dataRG85, dataRG99, dataCH}}, 
Row[{ListPlot[xl, Frame -> True, 
  PlotStyle -> Table[{Thickness[0.003], col[[i]]}, {i, 1, 8}], 
  Joined -> True, PlotMarkers -> {Automatic, 15}, 
   FrameLabel -> {"\[Alpha]", "Percentage %"}, 
FrameStyle -> Directive[FontSize -> 17, FontFamily -> "Helvetica"], 
PlotRange -> plrange, Axes -> False, ImageSize -> 600], 
Grid[MapIndexed[{Graphics[{col[[First[#2]]], 
     Inset[Style[{\[FilledCircle], \[FilledSquare], \
\[FilledDiamond], \[FilledUpTriangle], \[FilledDownTriangle], \
\[EmptyCircle], \[EmptySquare], \[EmptyDiamond]}[[First[#2]]], 15]], 
     Thickness[0.08], Line[{{0, 0}, {1, 0}}]}, AspectRatio -> 0.5,
     ImageSize -> 20], 
   Style[ley[[First[#2]]], Bold, FontSize -> 10, 
    FontFamily -> "Helvetica"]} &, xl]]}, Spacer[10]]]

enter image description here

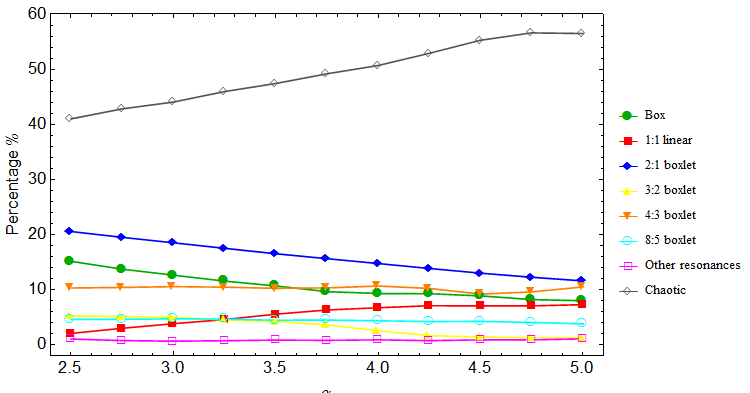
If you have Version 9, you can also use PlotLegends and LineLegend:

 ListPlot[{dataRG00, dataRG11, dataRG21, dataRG32, dataRG43, dataRG85, 
 dataRG99, dataCH}, Frame -> True, 
 PlotStyle -> Table[{Thickness[0.003], col[[i]]}, {i, 1, 8}], 
 Joined -> True, PlotMarkers -> {Automatic, 15}, 
 FrameLabel -> {"\[Alpha]", "Percentage %"}, 
 FrameStyle -> Directive[FontSize -> 17, FontFamily -> "Helvetica"], 
 PlotRange -> plrange, Axes -> False, ImageSize -> 600, 
 PlotLegends -> LineLegend[ley, LegendMarkers -> Automatic]]

enter image description here

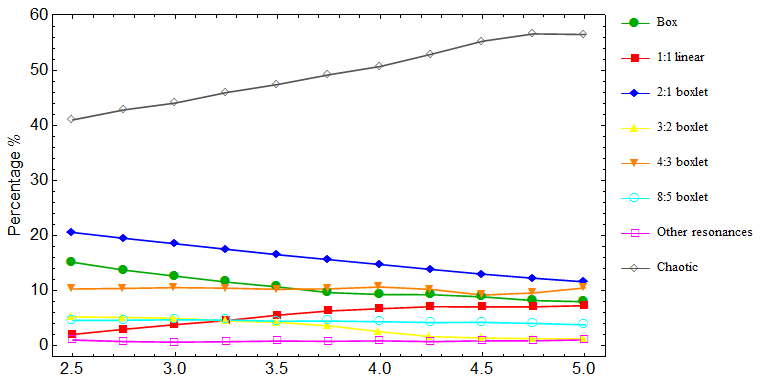
Update: "to place the legends at the upper right part of the plot" and "to increase the vertical distance between each label", you can use

 PlotLegends ->  Placed[LineLegend[ley, LegendMarkers -> Automatic, 
   LegendMarkerSize -> {{30, 25}}], {After, Top}]

to get

enter image description here

$\endgroup$
4
  • $\begingroup$ Thank you! One more question... what if I want to move the legends at the upper right part of the plot (always outside)? Or increase the vertical distance between each label (i.e. 1:1, 2:1) ? $\endgroup$
    – Vaggelis_Z
    Commented Apr 4, 2013 at 10:03
  • $\begingroup$ I do have the 9.0 version. $\endgroup$
    – Vaggelis_Z
    Commented Apr 4, 2013 at 10:06
  • $\begingroup$ @Vaggelis_Z, to increase the vertical distance between lables you can use the option LegendMarkerSize; e.g., LegendMarkerSize -> {{55, 25}} where the second element of the list controls the vertical size of each legend. Re placement of the legend on the upper right, I think there was a Q/A about that; I will post the link if I can find it. $\endgroup$
    – kglr
    Commented Apr 4, 2013 at 10:19
  • $\begingroup$ Many many thanks! $\endgroup$
    – Vaggelis_Z
    Commented Apr 4, 2013 at 10:41
5
$\begingroup$

Took me a while to figure it out myself. The co-ordinates are:

{
  {Position on graphic in x, Position on graphic in y}, 
  {Part of plot legend that should be at the assigned position on graphic}
}

So: {{0.9, 0.9}, {1, 1}} assigns a location on my graphic 90% up the graphic and 90% to the right, and puts the upper right corner of my plot legend at this point.

or {{0.5, 0.5}, {0.5, 0.5}} puts the middle of my plot legend in the middle of my graphic.

$\endgroup$
4
$\begingroup$
PlotLegends -> 
 Placed[LineLegend[Automatic, {"Short circuit"}], {0.15, 0.7}]

0.15 and 0.7 are the inputs for placing the legend in the plot. 0.15 means the centre of a legend is at 15% of x-axis length and 0.7 means 70% length of the y-axis. In fact, if you input 0.5,0.5, you will be placing the legend in the centre of graph or 1,0 means at the end of the x-axis where y=0. I hope this helps you.

$\endgroup$
2
$\begingroup$

You can do:

PlotLegends -> 
    Placed[ LineLegend[{"xx", "yy", "zz", "kk", "ww"}, 
                        Joined -> Automatic, LegendFunction -> Frame, 
                        LegendMarkerSize -> {{35, 10}}], 
           {{0.2, 0.5}, {0.2, 0.02}}]

The position is given by Placed[***, {{0.2, 0.5}, {0.2, 0.02}}]

$\endgroup$
1
  • 3
    $\begingroup$ what do the coordinates above {{0.2, 0.5}, {0.2, 0.02}} mean? The documentation on Placed does not explain how those coordinates are defined. thank you. $\endgroup$
    – user26614
    Commented Feb 25, 2015 at 2:37

Your Answer

By clicking “Post Your Answer”, you agree to our terms of service and acknowledge you have read our privacy policy.

Not the answer you're looking for? Browse other questions tagged or ask your own question.