11
$\begingroup$

I just noticed another plot legend question today and while user solutions to this, in particular code by @Jens, are IMO better than the built in solutions, exact positioning often still requires some trial and error.

How can I easily position my legends by way of locators?

$\endgroup$
4
  • $\begingroup$ You've probably seen it, but just in case someone else is interested: there is a movie I made to describe how legend positioning works without locators: have a look at this answer to the question Creating legends for plots with multiple lines? $\endgroup$
    – Jens
    Commented Jun 28, 2012 at 0:03
  • $\begingroup$ Hi @Jens. I had seen that though had forgotten it. The reason I made this is to be able to locate the legends outside the plotted area. Unless I have misunderstood the movie, which I just had a look at, the method locates within the plotted area. Also I have found DrawingTools very "finicky" for selecting elements in a graphic and much prefer using locators. Finally this method makes it easy to retrieve the static code for repetitive positioning once you find something you like (InputForm[p2]). $\endgroup$ Commented Jun 28, 2012 at 0:51
  • $\begingroup$ yes, that's why I'm not posting an answer right now because this question explicitly asks for locators, and yours works great. I think I know how to fix my approach using DrawingTools to make it less finicky, and I already settled on a way to make the label movable outside the plot as well - see here. I bet a combination of these partial solutions would be great - and right when we have solved it all, Wolfram will release a new version that has perfect labeling (I wish). $\endgroup$
    – Jens
    Commented Jun 28, 2012 at 1:39
  • $\begingroup$ @Jens The occasional difficulty I have when clicking in the graphics window is not specific to your code, it is whenever I use that interface. Occasionlly a cell suddenly turns into an input cell when I click on graphics as well. Consequently I tend to not use it. But a key thing is that using locators makes it very easy to extract the exact positioning so that you have stand alone code for later use. I'm not sure how big a priority having professional looking legends is so maybe there won't be any changes in V9. I'd be surprised if rolling your own wouldn't always be a better option actually. $\endgroup$ Commented Jun 28, 2012 at 2:21

1 Answer 1

12
$\begingroup$

Given that plot legend question keep arising I thought I would share my approach to legend positioning. I want to be able to use the legend as a locator and move it to the exact position I want it.

pt = Scaled[{0.5, 0.5}];

(* image padding for the ListLinePlot *)
{{l, r}, {b, t}} = {{20, 100}, {100, 10}};
(* width and height of the ListLinePlot *)
{w, h} = {400, 300};

opts = {AspectRatio -> 0.2, ImageMargins -> 0, ImagePadding -> 0, 
   ImageSize -> 30};

(* toy legend *)
legend = Column[{
    Grid[{{Graphics[{AbsoluteThickness[5], Red, 
         Line[{{0, 0}, {1, 0}}]}, opts], Style["label1", 16]}}, 
     Alignment -> {Center, Center}, Spacings -> 0.5],
    Grid[{{Graphics[{AbsoluteThickness[5], Blue, 
         Line[{{0, 0}, {1, 0}}]}, opts], Style["label2", 16]}}, 
     Alignment -> {Center, Center}, Spacings -> 0.5]
    }];

p1 = Overlay[{
   ListLinePlot[{{3, 6, 7, 2}, {1, 2, 3, 4}},
    AspectRatio -> h/w,
    ImageSize -> {w + l + r, h + b + t},
    ImagePadding -> {{l, r}, {b, t}},
    PlotStyle -> {{AbsoluteThickness[5], Red}, {AbsoluteThickness[5], 
       Blue}}],


 (* an empty graphic surrounding the ListLinePlot -- control this surrounding size by
 adjusting the image padding variables*)  
   Graphics[{}, AspectRatio -> (h + b + t)/(w + l + r), 
    ImageSize -> {w + l + r, h + b + t}, ImagePadding -> 0, 
    Epilog -> {Dynamic[Locator[Dynamic[pt], legend]]}]
   }, All, 2]

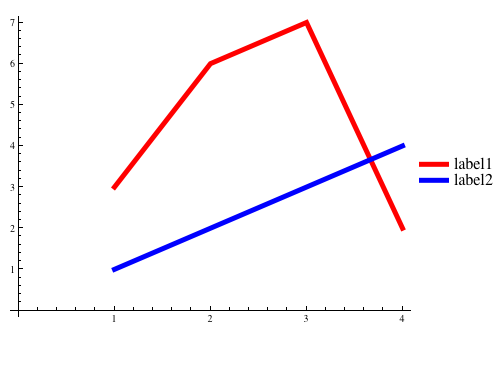
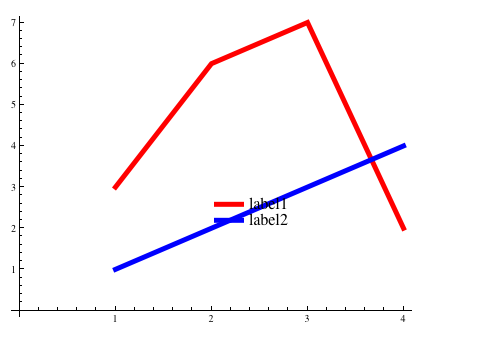
The legend can be positioned where you like. In this case I've started with large padding on the right and bottom. For column legends you may want to position to the right. For row legends on top or to the bottom.

Start:
enter image description here

move the legend:

enter image description here

You can see it working dynamically here.

To remove the dynamics from this and keep a static image:

p2 = p1 /. Locator[x_, y_] :> Inset[y, x] /. Dynamic :> Identity

Inset plots within a plot can be handled in a similar way -- namely as locators, there is no need for the surrounding graphic and the overlay in that case.

$\endgroup$
4
  • $\begingroup$ is there a way to use this method with GraphicsGrid ? $\endgroup$ Commented Jul 4, 2012 at 18:41
  • $\begingroup$ @RHall Use PlotRegion e.g. GraphicsGrid[{{Graphics[Rectangle[]], Graphics[Disk[]]},{Graphics[Disk[]],Graphics[Rectangle[]]}}, AspectRatio -> h/w, ImageSize -> {w + l + r, h + b + t},PlotRegion -> {{0, 0.75}, {0.25, 1}}] $\endgroup$ Commented Jul 4, 2012 at 22:32
  • $\begingroup$ Excellent! Thanks very much Mike! $\endgroup$ Commented Jul 4, 2012 at 23:35
  • $\begingroup$ Nice one +1 .... $\endgroup$
    – Rojo
    Commented Jul 21, 2012 at 2:30

Your Answer

By clicking “Post Your Answer”, you agree to our terms of service and acknowledge you have read our privacy policy.

Not the answer you're looking for? Browse other questions tagged or ask your own question.