6
$\begingroup$

I'm using Show to combine three plots. The code I write is as follows:

g1 = Plot[x^2 + 3, {x, 0, 3}, 
   PlotLegends -> 
    Placed[LineLegend[{TraditionalForm[k == 1]}, 
      LegendLayout -> "Row", 
      LegendFunction -> (Framed[#1, FrameMargins -> 0] & )], Below], 
   AxesOrigin -> {0, 0}, PlotStyle -> Red];
g2 = Plot[x^3 + x, {x, 1, 4}, 
   PlotLegends -> 
    Placed[LineLegend[{TraditionalForm[k == 2]}, 
      LegendLayout -> "Row", 
      LegendFunction -> (Framed[#1, FrameMargins -> 0] & )], Below], 
   AxesOrigin -> {0, 0}, PlotStyle -> Blue];
g3 = Plot[20/x, {x, 1/2, 4}, 
   PlotLegends -> 
    Placed[LineLegend[{TraditionalForm[k == 3]}, 
      LegendLayout -> "Row", 
      LegendFunction -> (Framed[#1, FrameMargins -> 0] & )], Below], 
   AxesOrigin -> {0, 0}, PlotStyle -> Black];
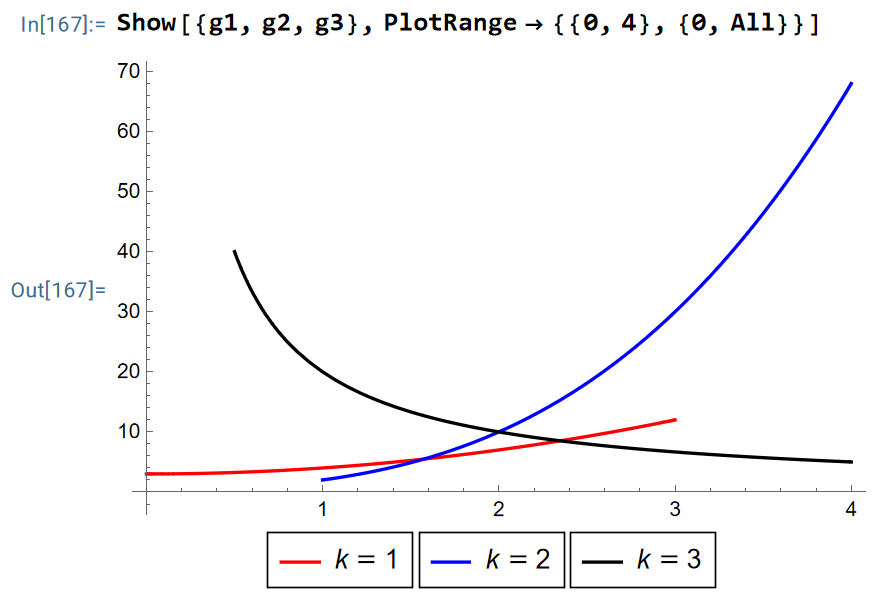
Show[{g1, g2, g3}, PlotRange -> {{0, 4}, {0, All}}]

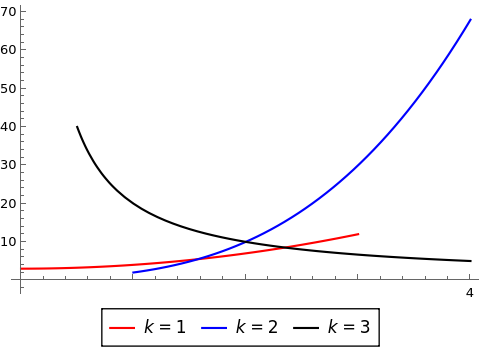
The output is the following: enter image description here

As we can see in the output, the three legends are seperate in three frames. How can I place the three legends in a row in one frame?

$\endgroup$
2

2 Answers 2

6
$\begingroup$
show = Show[{g1, g2, g3}, PlotRange -> {{0, 4}, {0, All}}];

Extract the main plot and legends from show and reorganize them in desired form:

plot = Cases[show, _Graphics, All][[1]];

legendargs = Transpose @
   Cases[show, LineLegend[arg1_, arg2_, opts___] :> {arg1, arg2, opts}, All];

newlegend = Placed[LineLegend @@ legendargs, 
    ## & @@ First @ Cases[show, Placed[_, a___] :> {a}, All]];


Legended[plot, newlegend]

enter image description here

$\endgroup$
8
  • $\begingroup$ It indicates an error when I run the code newlegend = Placed[LineLegend @@ legendargs, ## & @@ First @ Cases[show, Placed[_, a___] :> {a}, All]]. Did you miss something in this code? $\endgroup$
    – Ya He
    Commented Apr 30, 2023 at 12:51
  • $\begingroup$ @YaHe, what is the error message? $\endgroup$
    – kglr
    Commented Apr 30, 2023 at 12:54
  • $\begingroup$ It indicates that "First::nofirst, the length of {} is zero, there is no first element" $\endgroup$
    – Ya He
    Commented Apr 30, 2023 at 13:02
  • 1
    $\begingroup$ It could be version/os difference (I am using V13.1.0 on Linux). Try newlegend=Placed[LineLegend @@ legendargs, Below]. $\endgroup$
    – kglr
    Commented Apr 30, 2023 at 13:12
  • 1
    $\begingroup$ Many thanks. It works now (I'm also using V13.1). Besides, by reducing the FrameMargins in the plot g1, g2, g3, I can reduce the margin of the legends frame in the final output. $\endgroup$
    – Ya He
    Commented Apr 30, 2023 at 13:43
4
$\begingroup$
With[{ll = LineLegend}, 
 ToExpression@
   ToBoxes@Show[{g1, g2, g3}, 
     PlotRange -> {{0, 4}, {0, All}}] //. {ll[{a1__}, {b1__}, c__], 
    ll[{a2_}, {b2_}, c__], rest___} :> {ll[{a1, a2}, {b1, b2}, c], rest}]

To understand why ToBoxes and ToExpression are used, read the following:

Graphics in Notebook Different from Graphics Expression?

Function equal to Ctrl+Shift+I

$\endgroup$
6
  • $\begingroup$ Thanks! Your proposal works well! $\endgroup$
    – Ya He
    Commented Apr 30, 2023 at 13:46
  • $\begingroup$ I have one question about your code. Sometimes the combined legend may be displayed in two rows (this happens when each legend is a bit long). Do you know how to make the combined legend always shown in one row? $\endgroup$
    – Ya He
    Commented May 2, 2023 at 0:47
  • $\begingroup$ @YaHe It's answered in this post: mathematica.stackexchange.com/q/26231/1871 $\endgroup$
    – xzczd
    Commented May 2, 2023 at 2:09
  • $\begingroup$ Thanks! I have solved the problem. $\endgroup$
    – Ya He
    Commented May 2, 2023 at 2:20
  • $\begingroup$ @YaHe Then you should tell kglr you've solved this. $\endgroup$
    – xzczd
    Commented May 2, 2023 at 2:45

Your Answer

By clicking “Post Your Answer”, you agree to our terms of service and acknowledge you have read our privacy policy.

Not the answer you're looking for? Browse other questions tagged or ask your own question.