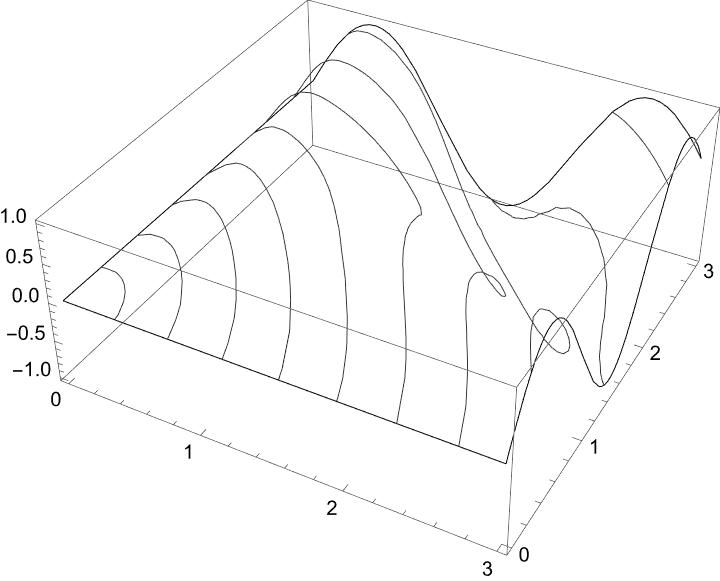
Startingpoint is the following 3D plot:
test = Plot3D[Sin[x y], {x, 0, 3}, {y, 0, 3},
  MeshFunctions -> {Sqrt[#1^2 + #2^2 + #3^2] &}, Mesh -> 10,
  PlotStyle -> None]
I would like to create a list with the different meshlines. When I look at
FullForm[test]
I can see a GraphicsComplex. For me it's not easy to understand how to generate the different lines. I would like to get a output like
{Line[{2.14285705102040, 0.42857158163265,
  0.794611641214728}, {2.357142734693877, 0.42857158163265,
  0.846940533910772}, {2.571428418367346, 0.42857158163265,
  0.892131358058375}, {2.78571410204081, 0.42857158163265,
  0.929803242524781}, {2.9999997857142855, 0.42857158163265,
  0.959638686277861}],Line[{},{},{}].....
Who has a suggestion?

