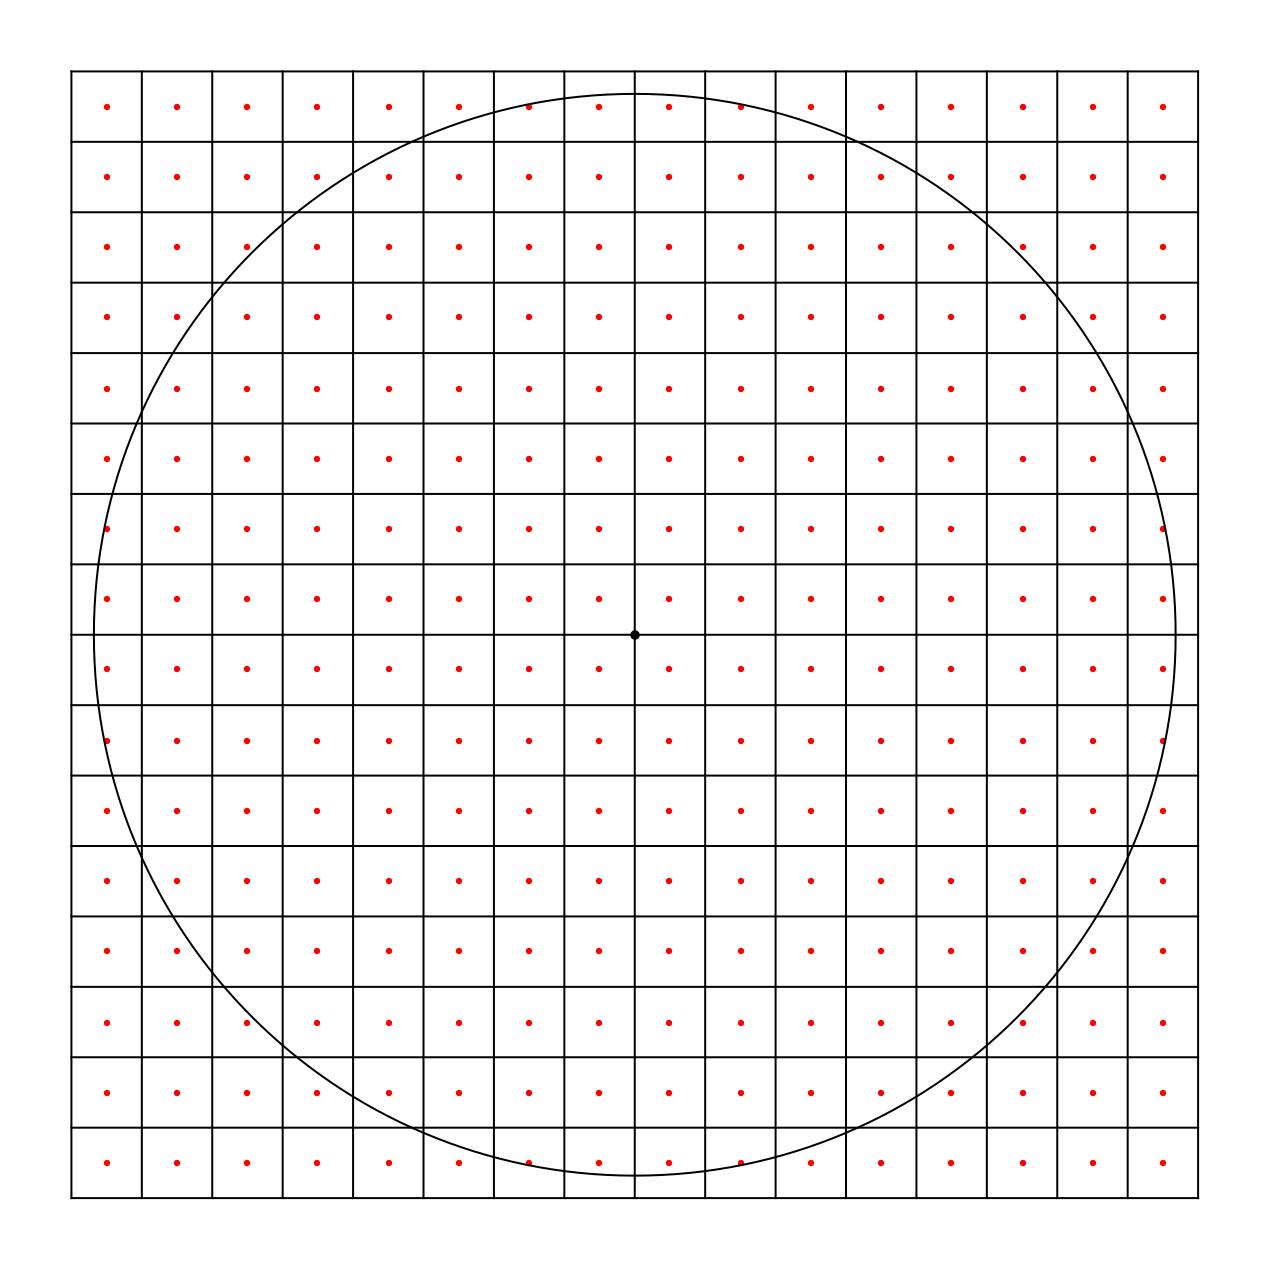
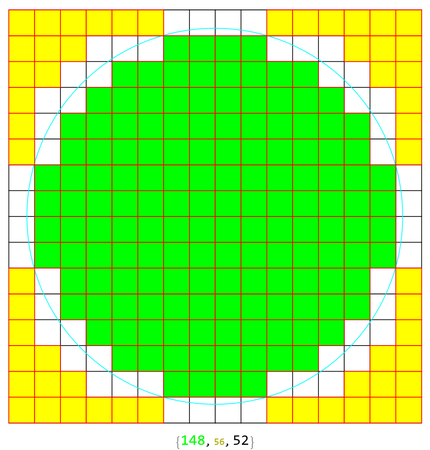
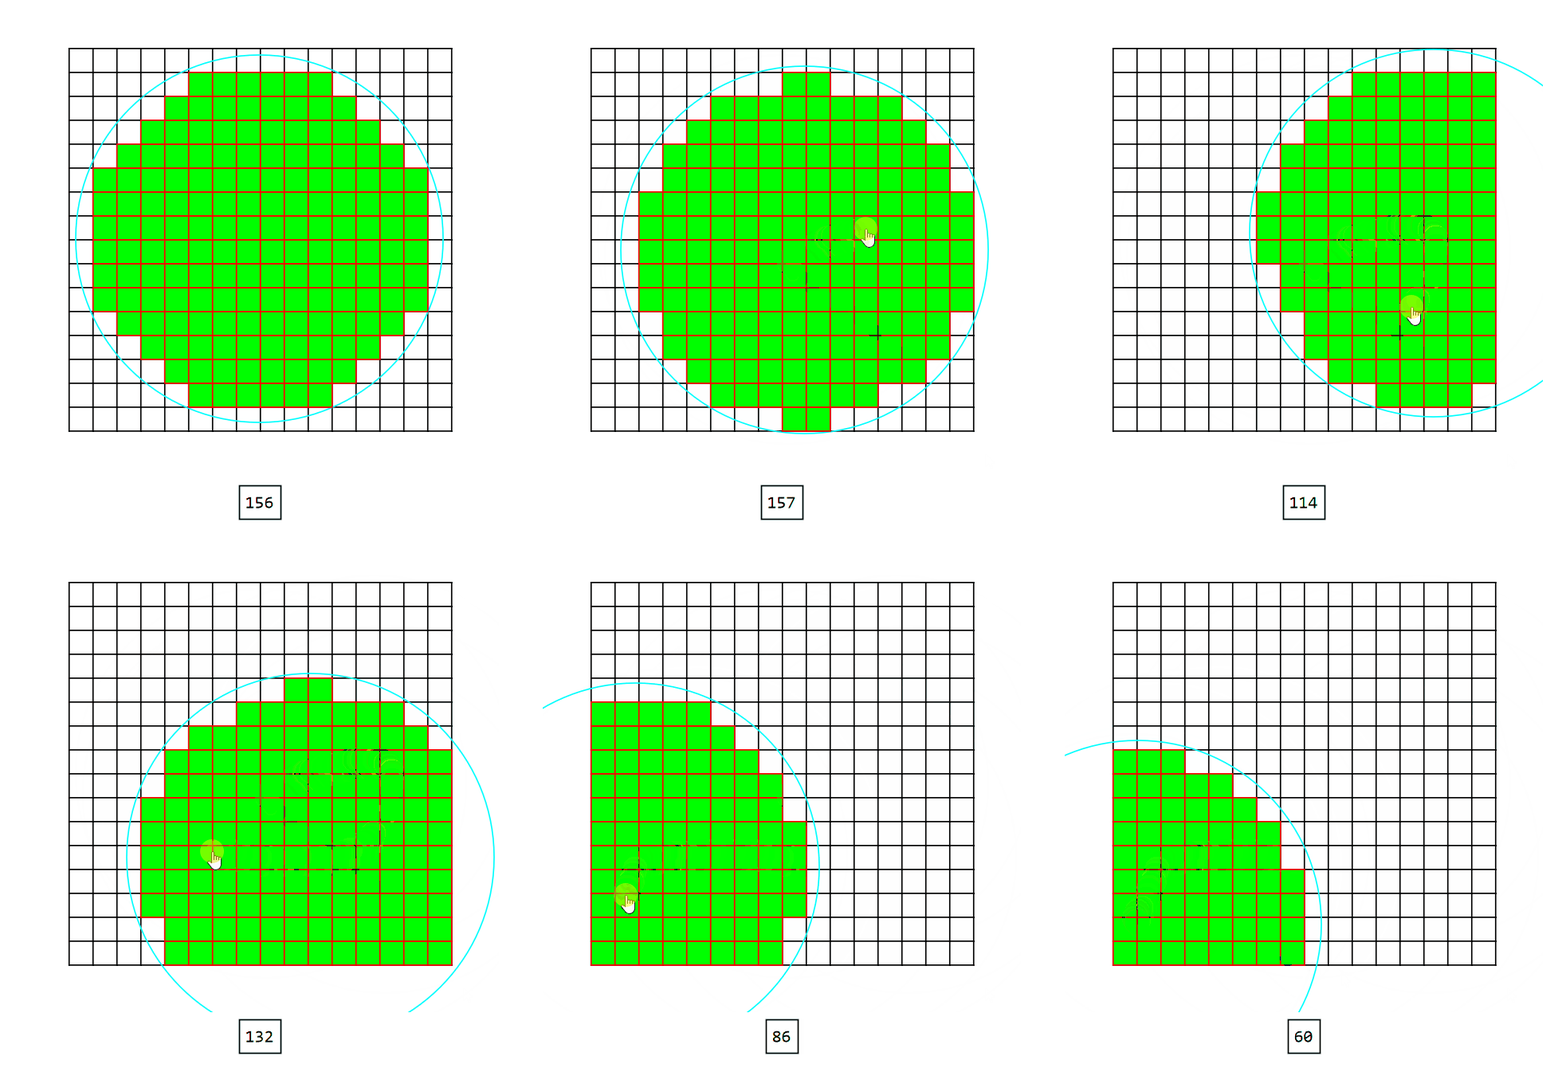
Given a lattice of unit squares I would like to find the number of squares that a curve (in the example below the curve is a circle) passes through and the number of squares that totally reside inside the curve.
In the example the number of squares that the curve passes through is 60 and the number that are fully within the curve is 156. These are the two numbers I would like to generate.
I have created a graphic of the situation with the following code.
grid = Table[{x, y}, {x, -8, 8, 1}, {y, -8, 8, 1}];
centres = Table[{x, y}, {x, -7.5, 7.5, 1}, {y, -7.5, 7.5, 1}];
g1 = Graphics@Line[#] & /@ grid;
g2 = Graphics@Line[#] & /@ Transpose@grid;
g3 = Graphics[{Red, PointSize[0.005], Point /@ centres}];
g4 = Graphics[Circle[{0, 0}, Sqrt[59]]];
g5 = Graphics[{Black, PointSize[0.0075], Point@{0, 0}}];
Show[g1, g2, g3, g4, g5, Frame -> False,
 PlotRange -> {{-9, 9}, {-9, 9}}, AspectRatio -> 1]
which produces:
I am not sure how to set such a thing up - I have looked in the documentation but I am not seeing something similar at all.
Any help would be much appreciated.


