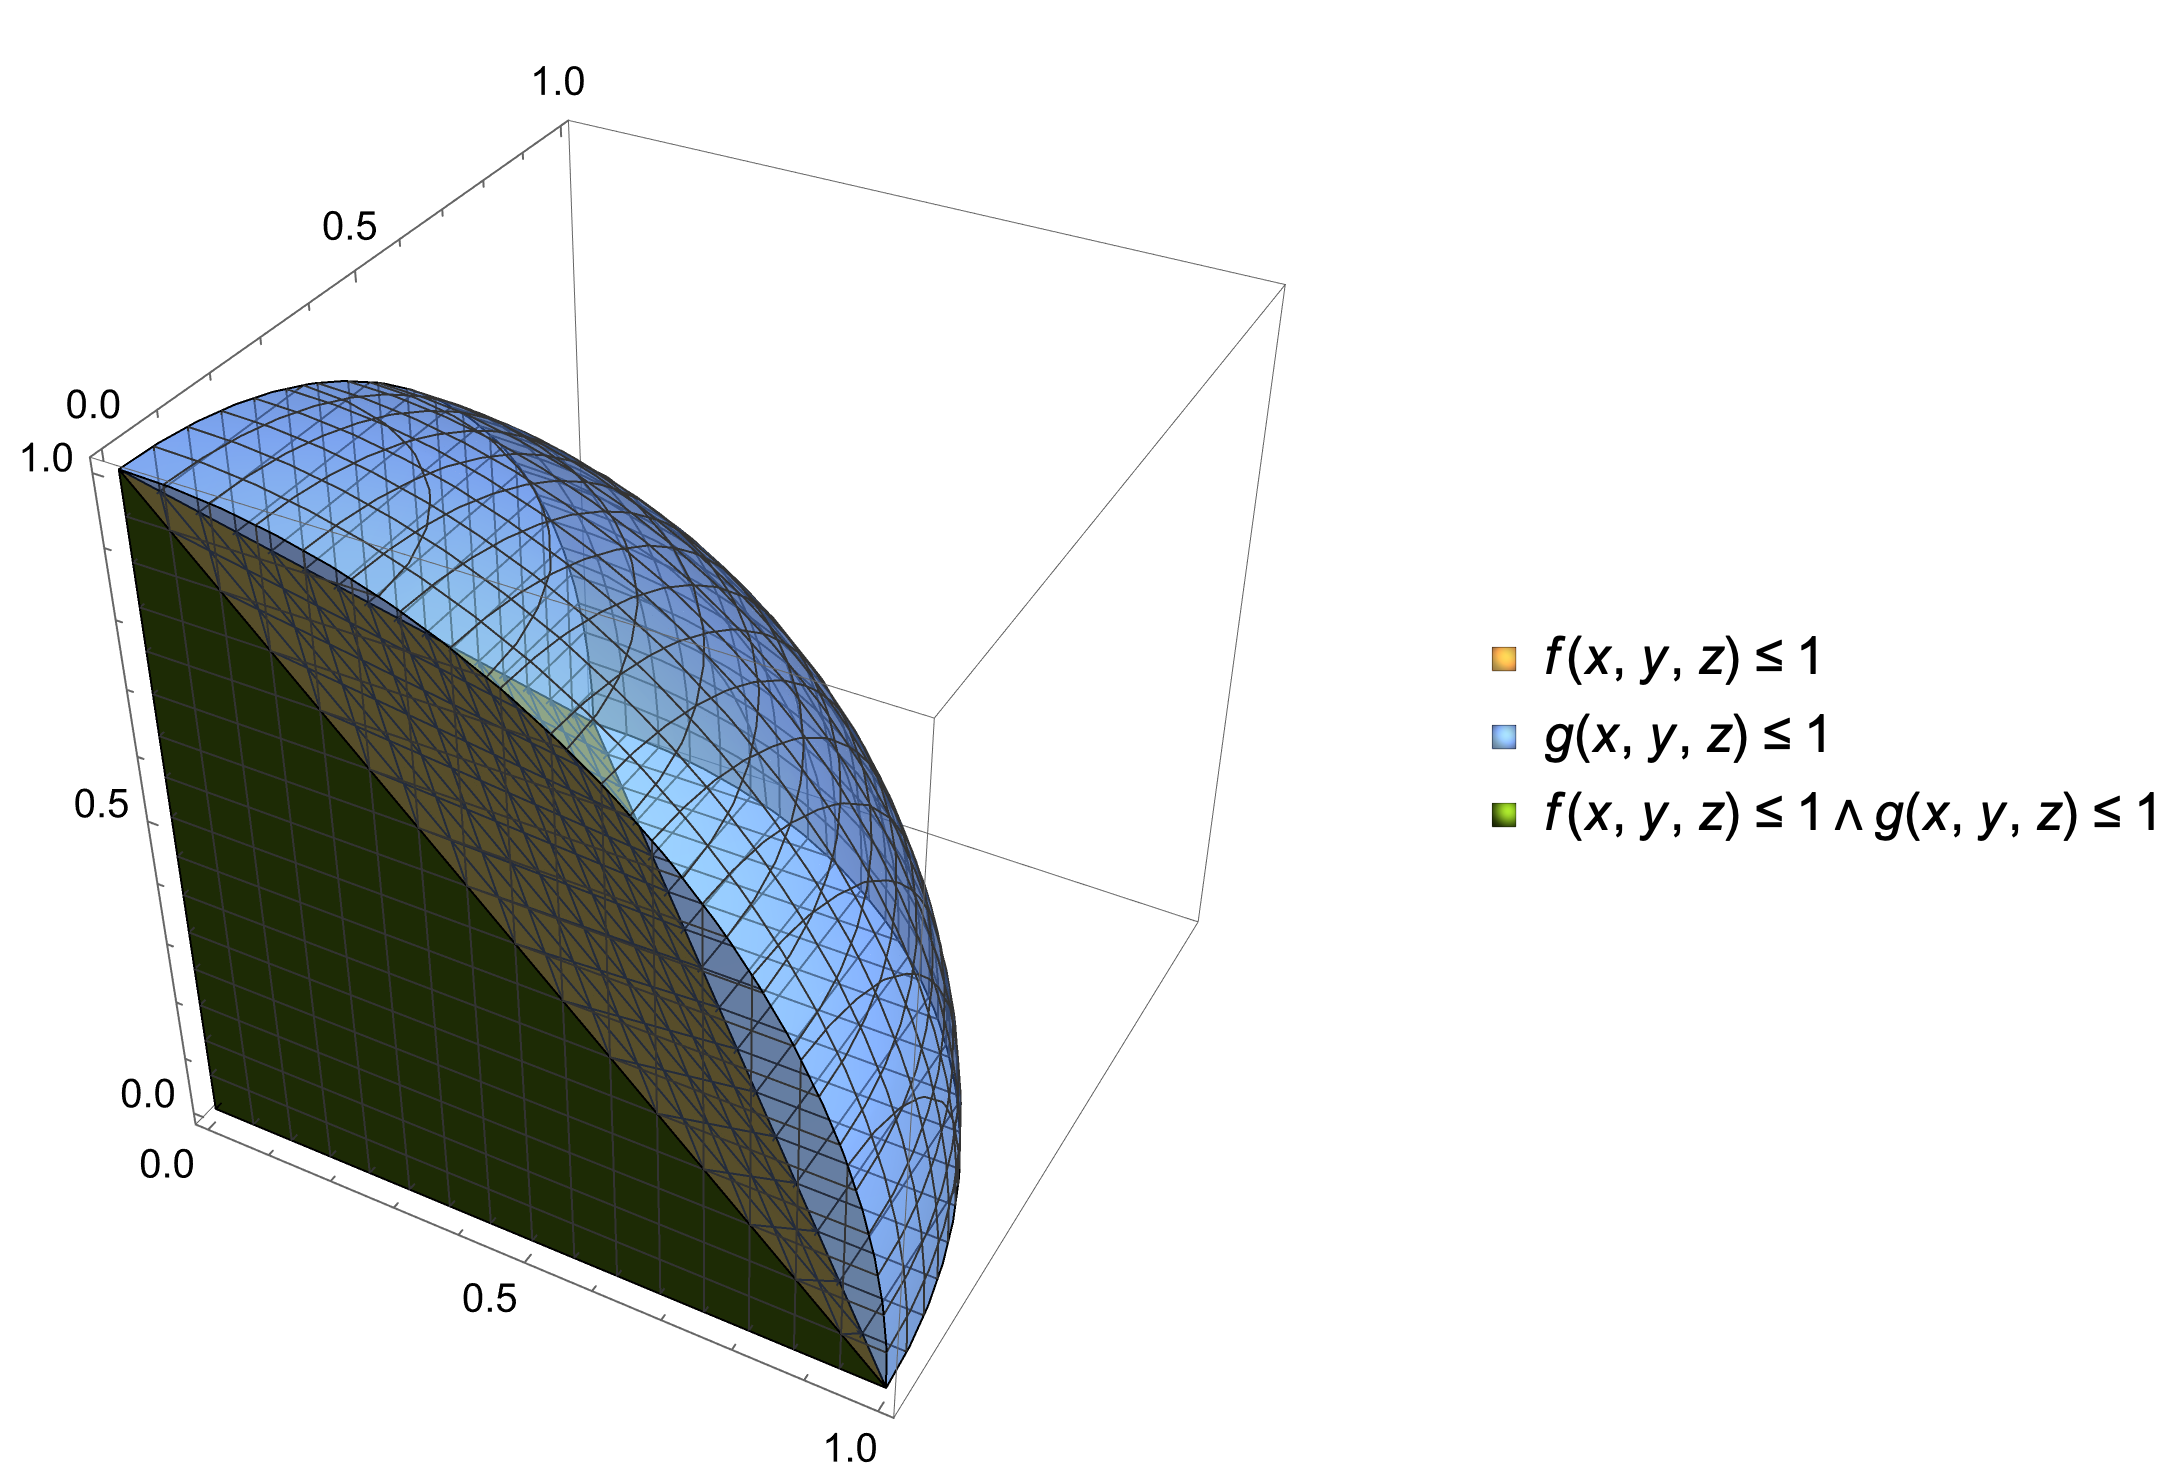
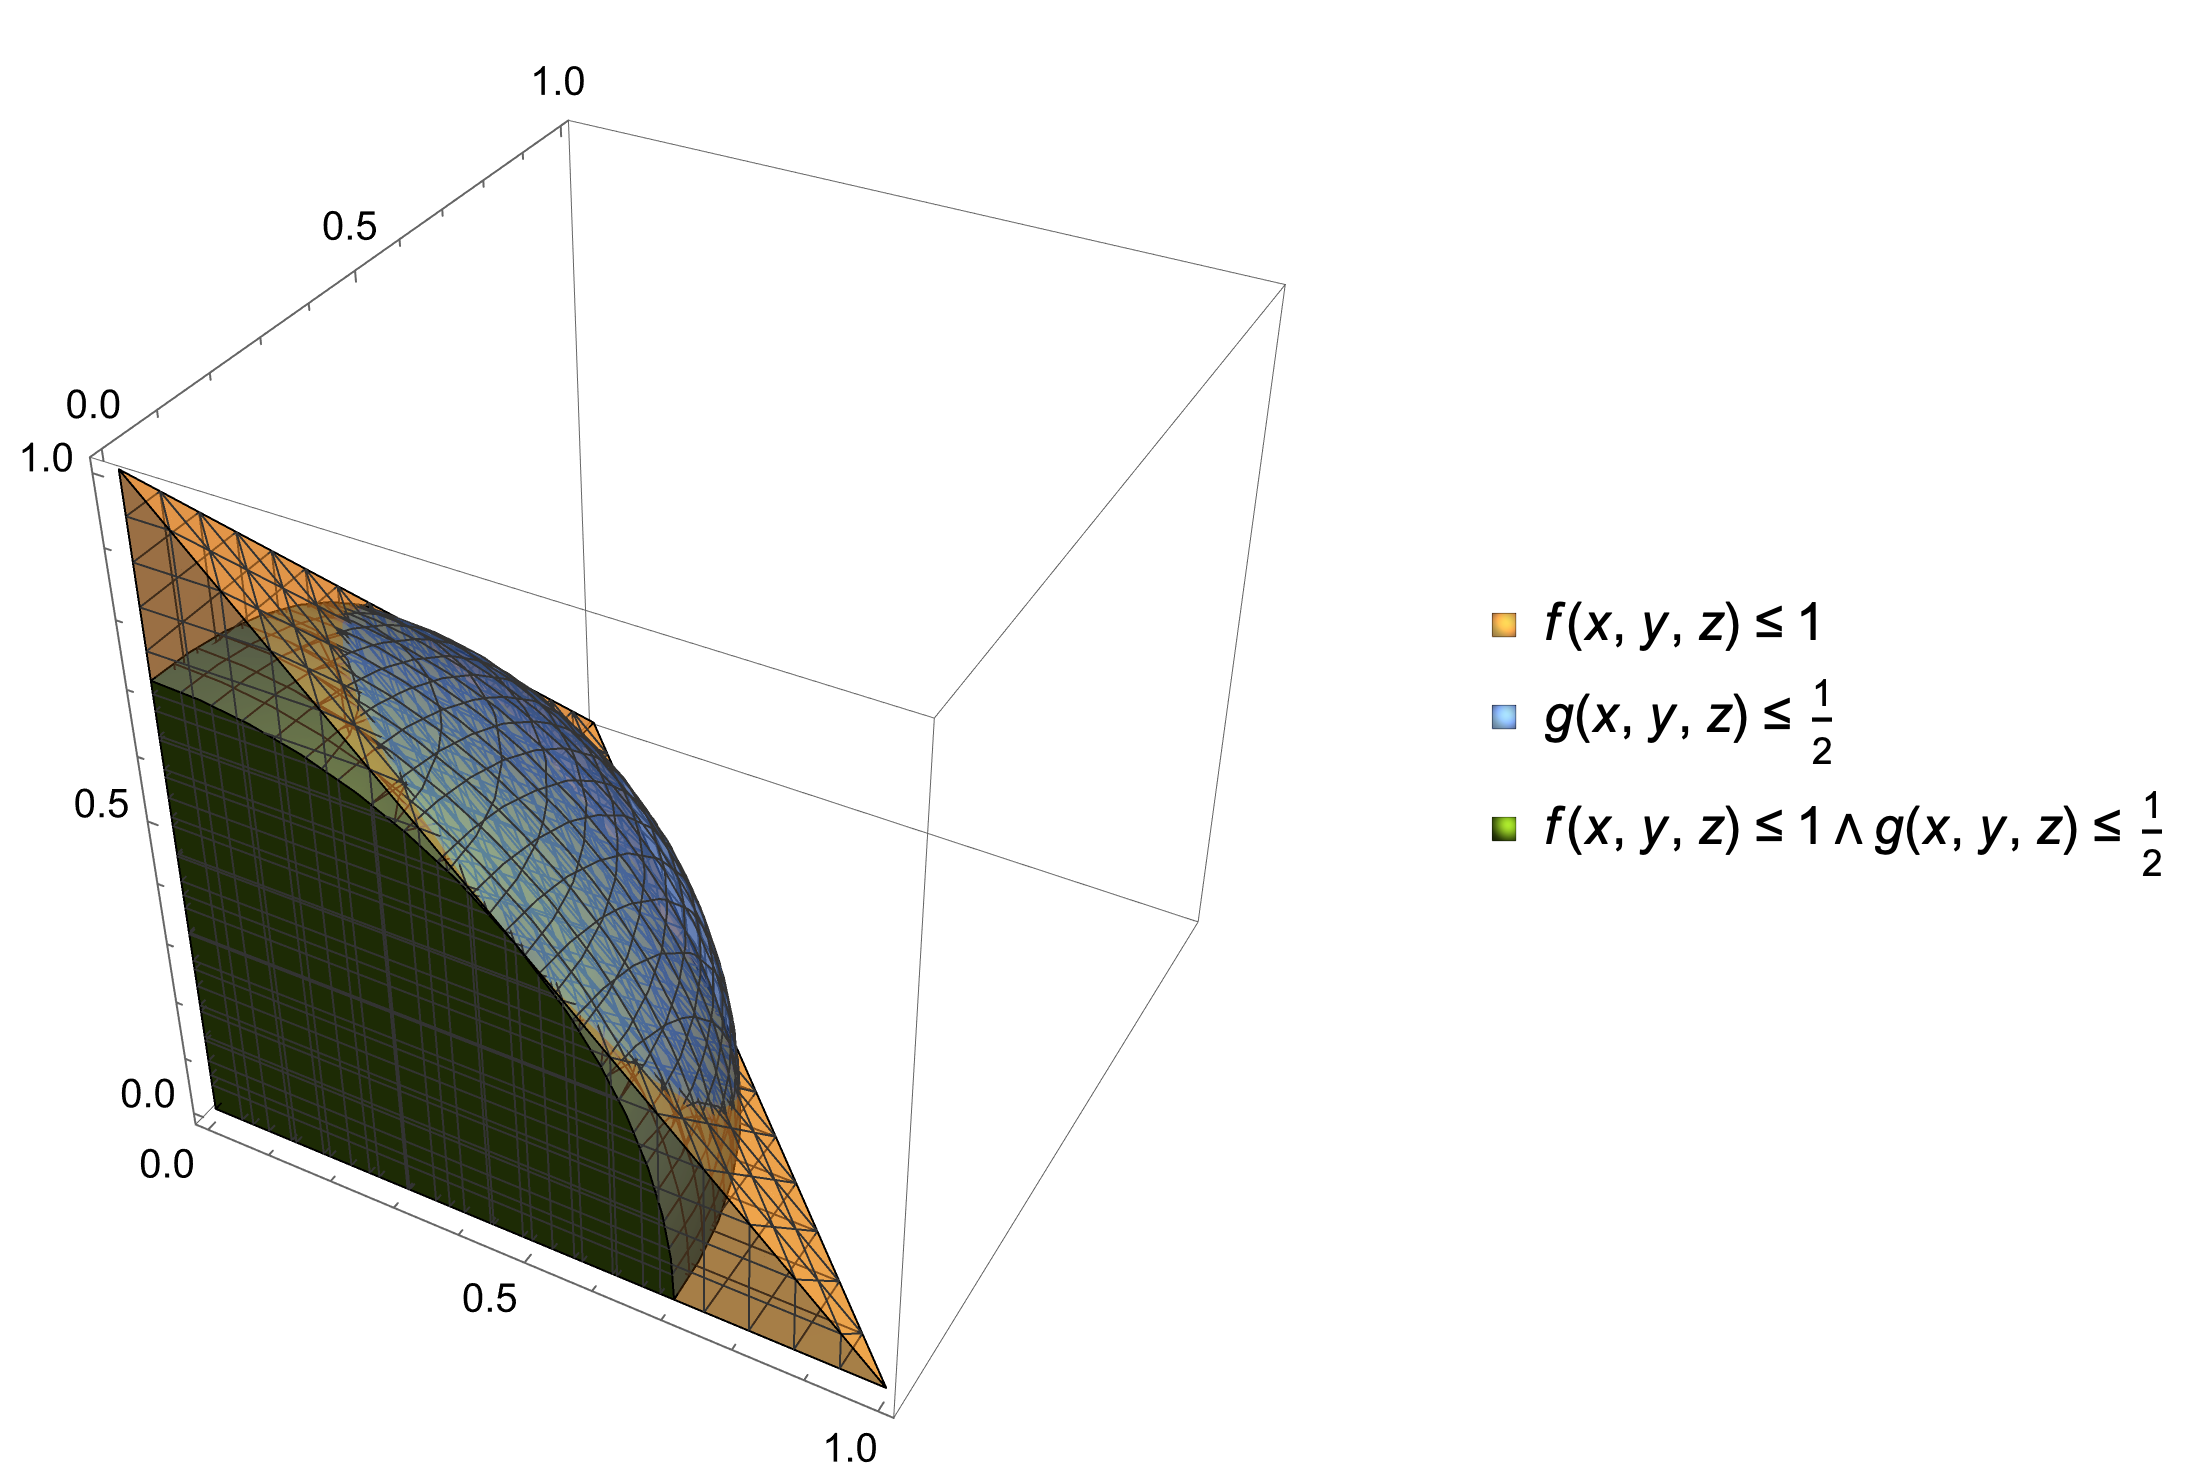
I try to plot the following inequalities f[x,y,z]<=1 and g[x,y,z]<=1 in a single plot such that both the regions are visible and also the intersection is highlighted. I tried the RegionPlot3D but it only shows the region which is common to them.
f[x_, y_, z_] = x + y + z;
g[x_, y_, z_] = x^2 + y^2 + z^2;

RegionPlot3D[f[x, y, z] <= 1, {x, 0, 1}, {y, 0, 1}, {z, 0, 1}]
RegionPlot3D[g[x, y, z] <= 1, {x, 0, 1}, {y, 0, 1}, {z, 0, 1}]


RegionPlot3D[{x + y + z <= 1, x^2 + y^2 + z^2 <= 1}, {x, 0, 1}, {y, 0, 1}, {z, 0, 1}, PlotStyle -> Opacity[1/3]]what you had in mind? $\endgroup$