0
$\begingroup$

I want to use Overlay to combine two plots. I noticed, that Overlay adds space at top and bottom, which I do not want to have.

Example:

plot = ListPlot[{{0, -130}}, PlotStyle -> {Black, PointSize[1]}, AspectRatio -> 1, Axes ->None, Frame -> None, PlotRange -> {{-50, 50}, {-265, 5}}, ImageSize -> 200, ImagePadding -> 0]

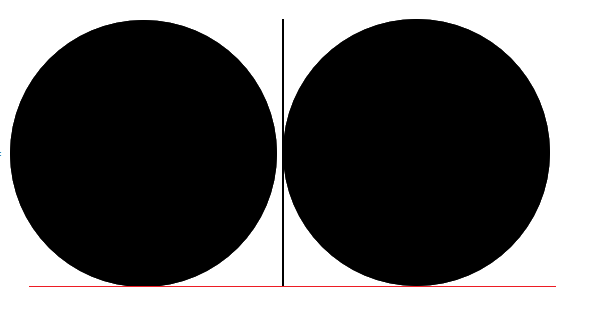
This creates a black Point, which touches all 4 edges. Now I want to use Overlay and to simplify the problem, I will only use it to display the plot:

overlayplot = Overlay[{plot}]

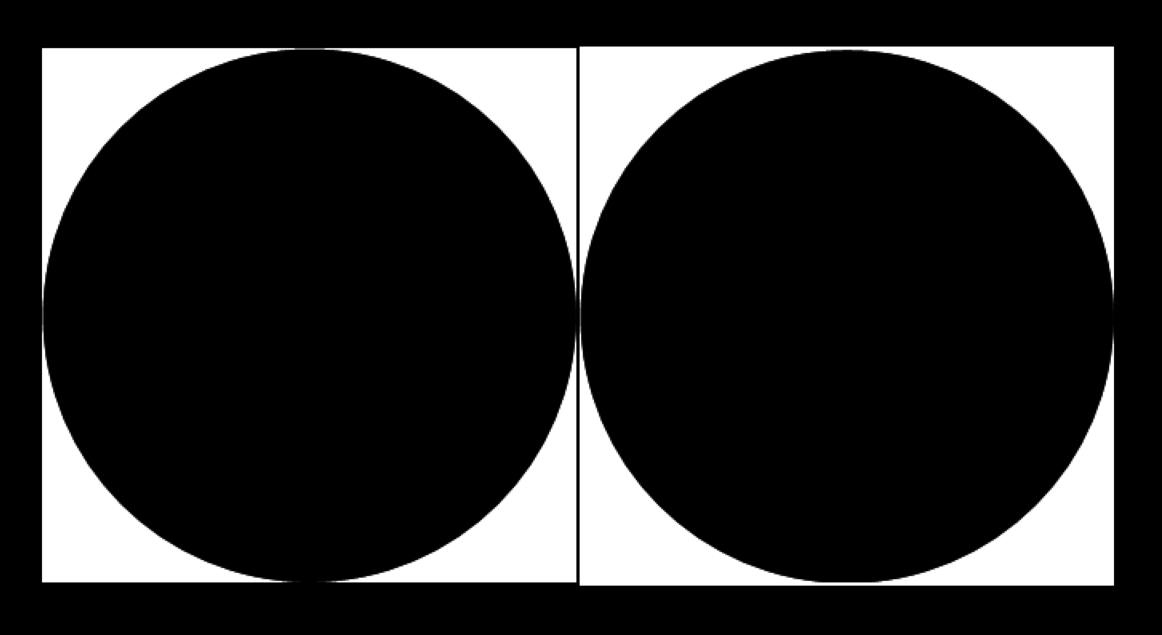
Strangely, the overlayplot added vertical space. This even changed the aspect ratio of the image. What could be the reason for this behaviour?

enter image description here

$\endgroup$
6
  • $\begingroup$ Changing the PlotRange to {{-50, 50}, {-300, 40}} instead of {{-50, 50}, {-265, 5}} fixes the problem, without being able to explain why. $\endgroup$ Commented Feb 22, 2023 at 9:41
  • $\begingroup$ Hello, I think the code you provided is a bit too minimalistic for us to understand what you are trying to do. You are providing one large point without explaining what it is you want to do. Do you want to overlap points in a plot or simply two large disks? If the former, better to use Show. If the latter, better to combine things using Graphics. $\endgroup$
    – alex
    Commented Feb 22, 2023 at 10:01
  • $\begingroup$ Overlay is a very powerful tool but it requires more thought as you need to have all parts 'aligned' if that makes sense. If you could tell us in more detail what it is you want to achieve, that would be useful. $\endgroup$
    – alex
    Commented Feb 22, 2023 at 10:04
  • $\begingroup$ I use Overlay to combine a 3D Graphic (e.g. ListPointPlot3D) with a 2D Graphic (e.g. ListPlot). This way I can have 3D graphics, while keeping the vectorgraphics properties of the 2D graphics in a pdf-export. Therefore I wanted to understand, why Overlay already has a vertical offset when using only a simple 2D graphic. $\endgroup$ Commented Feb 22, 2023 at 10:10
  • $\begingroup$ Hi again, apologies but I'm still a bit uncertain if your post will ultimately answer your actual problem, but see my answer below. I hope it helps. $\endgroup$
    – alex
    Commented Feb 22, 2023 at 10:28

1 Answer 1

0
$\begingroup$

I am not entirely certain I understand what you want to achieve with your 3D/2D overlay, but I think you can fix your issue if you set the following options in Overlay:

Overlay[{plot}, ContentPadding -> False, ImageSize -> All]

You can then compare the pure plot and the Overlay plot yourself in a Grid:

enter image description here

Note that Overlay does not output a standard Graphics object but its own thing. I personally avoid using Overlay and try to find different ways to obtain the desired effect using Graphics or Show which are a bit more robust in my experience.

$\endgroup$
2
  • $\begingroup$ I still have the problem with the added vertical space using your options. Its best visible after exporting as a .png and comparing the size. Maybe you know a command to combine 3D and 2D graphics, while still maintaining the vecor graphics. Show and Graphics cannot combine 3D and 2D plots. Using Inset in the 3D plot destroys the vector graphic properties of the 2D graphics. $\endgroup$ Commented Feb 22, 2023 at 11:17
  • 1
    $\begingroup$ Hi again, I would suggest that you edit your problem with the question that you would like answered. Treat the root not the symptom. Your current post contains no information about what you are doing with 2D/3D plots + exports other than that you have an issue with Overlay. $\endgroup$
    – alex
    Commented Feb 22, 2023 at 11:40

Your Answer

By clicking “Post Your Answer”, you agree to our terms of service and acknowledge you have read our privacy policy.

Not the answer you're looking for? Browse other questions tagged or ask your own question.