I've just started using Mathematica for one my university modules, so I tried replicating the results from our practical.
I've defined a function
f[x_]:= ax - R/2 x^2
After this, if I define
ListA = Table [f[j/5] /.a -> 5 /.R -> 1/4,{j,0,75}]
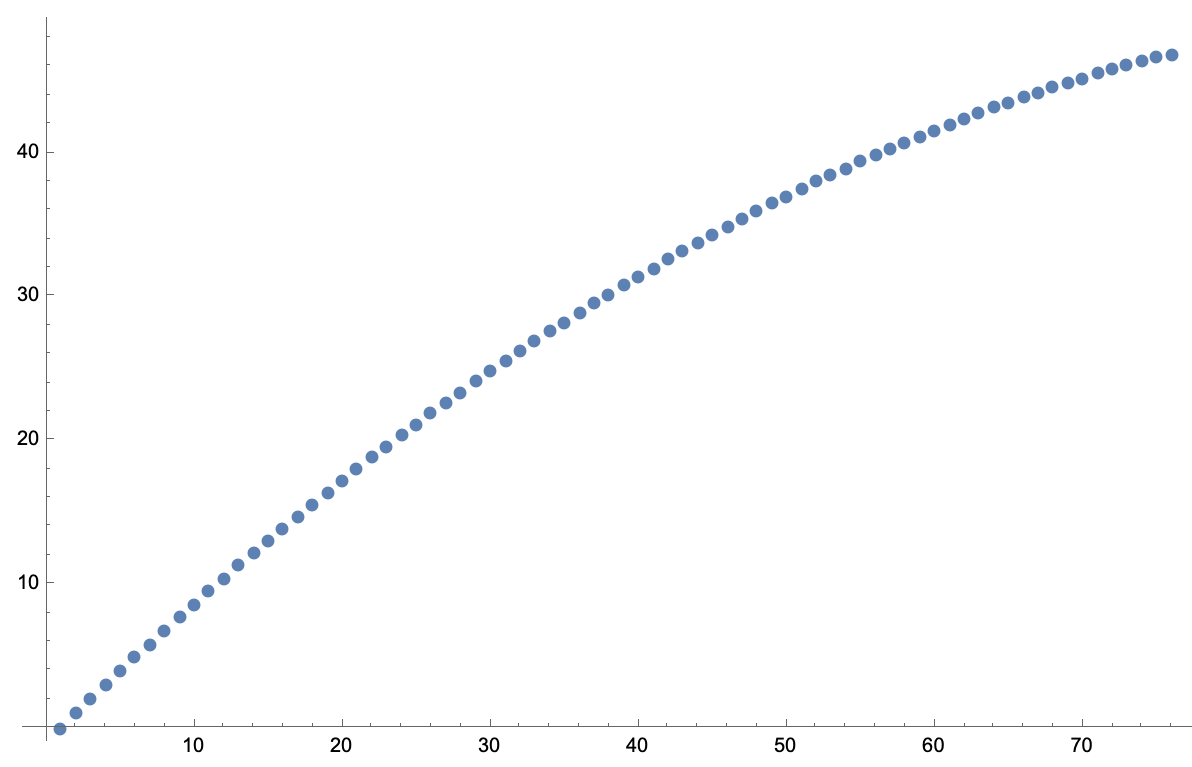
And then plot it with Plot1 = ListPlot[ListA] my graph will start from 1, rather than 0 (screenshot below)

However, if I define
ListB = Table [f{j/5},f[j/5] /.a -> 5 /.R -> 1/4,{j,0,75}]
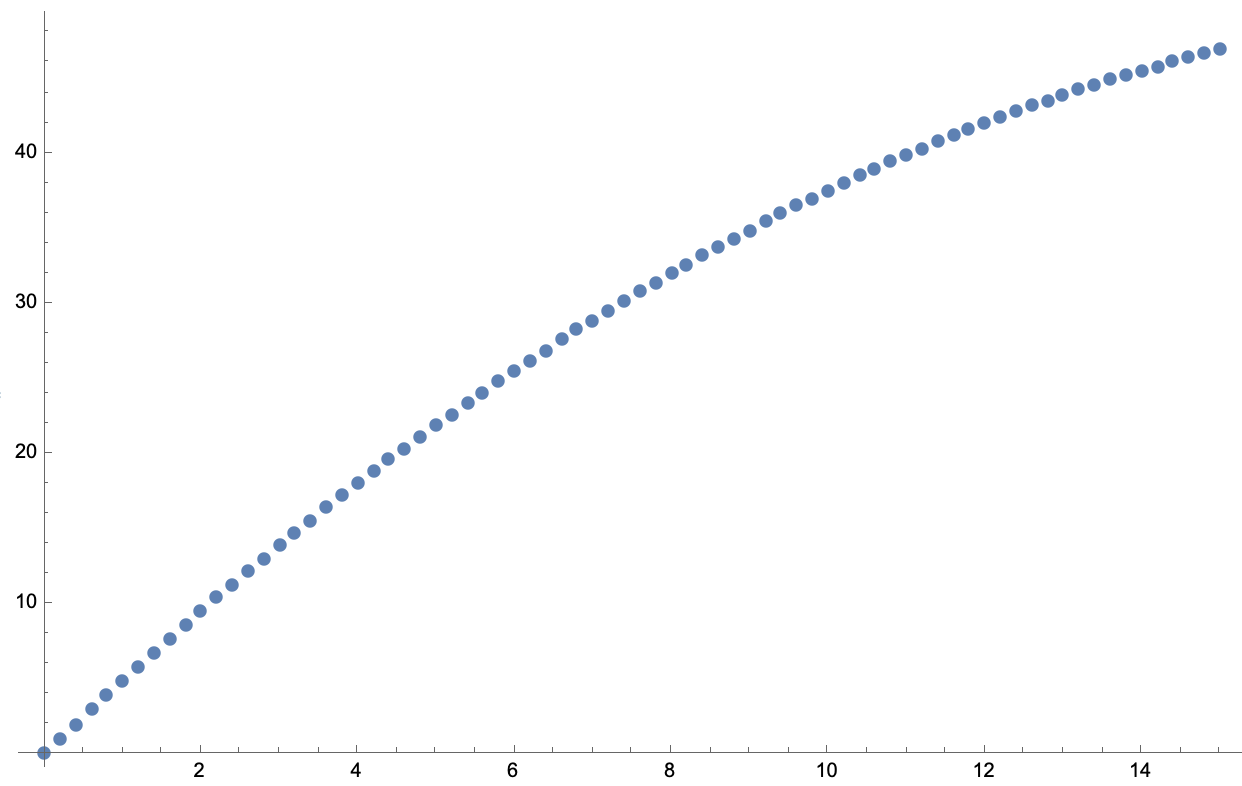
And then plot it with Plot2 = ListPlot[ListB], the graph starts from 0, as seen below

Can anyone explain to me the logic in these commands? I've tried searching for the answer both on StackExchange and in Google and couldn't find anything. I really appreciate it!
P.S. Is there any way to manually adjust the colour-coding of syntax? I've figured out that it changes to green/orange when I stop typing, but some colour-coding is different from the original code, so I am not sure what to do with it. This is my first time posting on StackExchange, so I am still figuring it out

DiscretePlot. Side note, you can replace multiple items simultaneously like/. {a -> 5, R -> 1/4}$\endgroup${{1, val1}, {2, val2}, ...}by default, starting "x coordinate" from 1. In the case ofListPlotthis fact is implied by the documentation definition of the first syntax form, where you can see $\{y_1,\ldots,y_n\}$ being interpreted as $\{\{i,y_i\},\ldots,\{n,y_n\}\}$ which corresponds with $\{\{1,y_1\}\},\ldots,\{n,y_n\}\}$. $\endgroup$