2
$\begingroup$

Let's say, we have a list of points such as

Points = {{0, 0}, {0, 1}, {1, 1}, {1, 0}, {0, 0}};

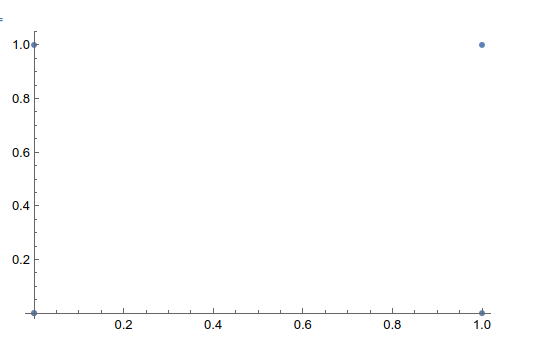
This is nothing but the corners of a square. List Plot:

enter image description here

Now I wanted to write a general function that connects the points I came up with this

PointList2Curve[pointlist_] := 
Module[{pointlist0 = pointlist, pathpatchs, Supports, Direcs,  F},
 Direcs = 
 Table[pointlist0[[i + 1]] - pointlist0[[i]], {i, 1, 
  Length[pointlist0] - 1}];
 Supports = pointlist0[[;; -1]];
 pathpatchs = 
 Table[Function[{t}, Supports[[i]] + t*Direcs[[i]]], {i, 1, 
 Length[pointlist0] - 1}];
 F[t_] := Module[{t0 = t, i}, 
 i = IntegerPart[t];
 pathpatchs[[i + 1]][t - i]];

F

 ];

If I then have the function returned as in

X = PointList2Curve[Points];

and then do a parametric plot,

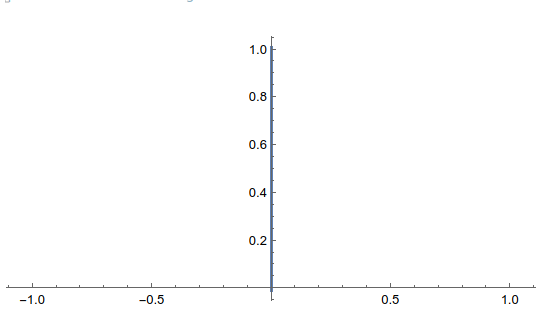
ParametricPlot[X[t], {t, 0, 4}]

enter image description here

This is of course not what it should look like. What should be happening is that that I get a square. I am pretty sure that, as far as I understand everything there is no logical mistake. After some trying I found that if I shorten the function such that the module returns only pathpatchs, (The line segments of the paths) They turn out to be all the same. Now my question is, why is that and does anybody have an idea how to fix that ?

Thanks in advance !

I get

$\endgroup$
3
  • $\begingroup$ One problem is here: Table[Function[{t}, Supports[[i]] + t*Direcs[[i]]], {i, 1, Length[pointlist0] - 1}]. Try that just on its own somewhere with an arbitrary value for the max of i. $\endgroup$
    – lericr
    Commented Jan 6, 2023 at 2:11
  • $\begingroup$ Also, I don't get the same output for the plot, so maybe there are some version differences. I'm running 13.2 on a mac. $\endgroup$
    – lericr
    Commented Jan 6, 2023 at 2:13
  • $\begingroup$ Please write a more-informative title... your title gives little if any hint about the content of your problem. $\endgroup$ Commented Jan 6, 2023 at 22:25

4 Answers 4

4
$\begingroup$
Points = {{0, 0}, {0, 1}, {1, 1}, {1, 0}, {0, 0}};

bsf = BSplineFunction[Points, SplineDegree -> 1];

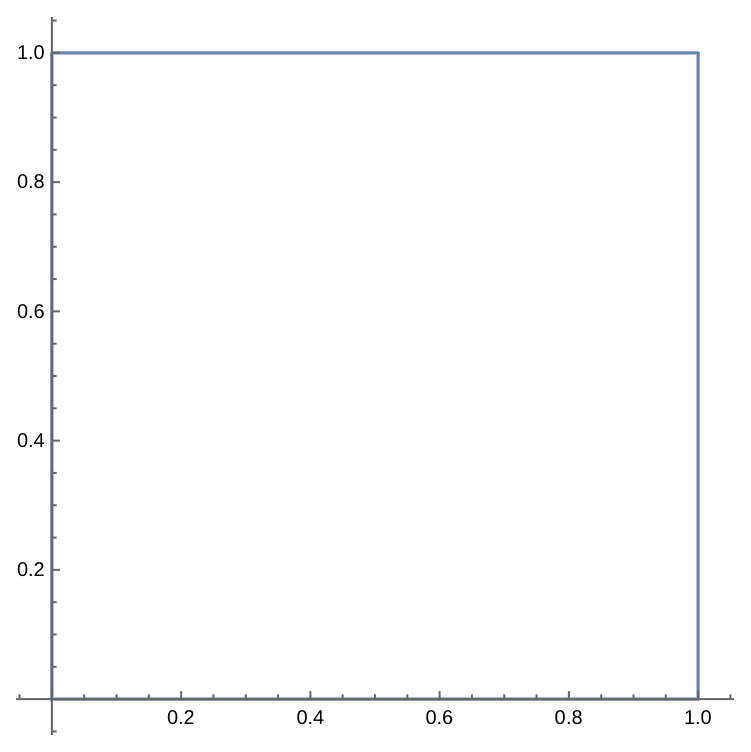
ParametricPlot[bsf[r], {r, 0, 1}]

plot of a square

In case your points don't already describe a closed curved, you may want to add the SplineClosed -> True option.

$\endgroup$
2
$\begingroup$
Clear["Global`*"]

Points = {{0, 0}, {0, 1}, {1, 1}, {1, 0}, {0, 0}};

FindCurvePath gives an ordering of the {xi, yi} that corresponds to one or more smooth curves.

curve = FindCurvePath[Points]

(* {{2, 1, 4, 3, 2}} *)

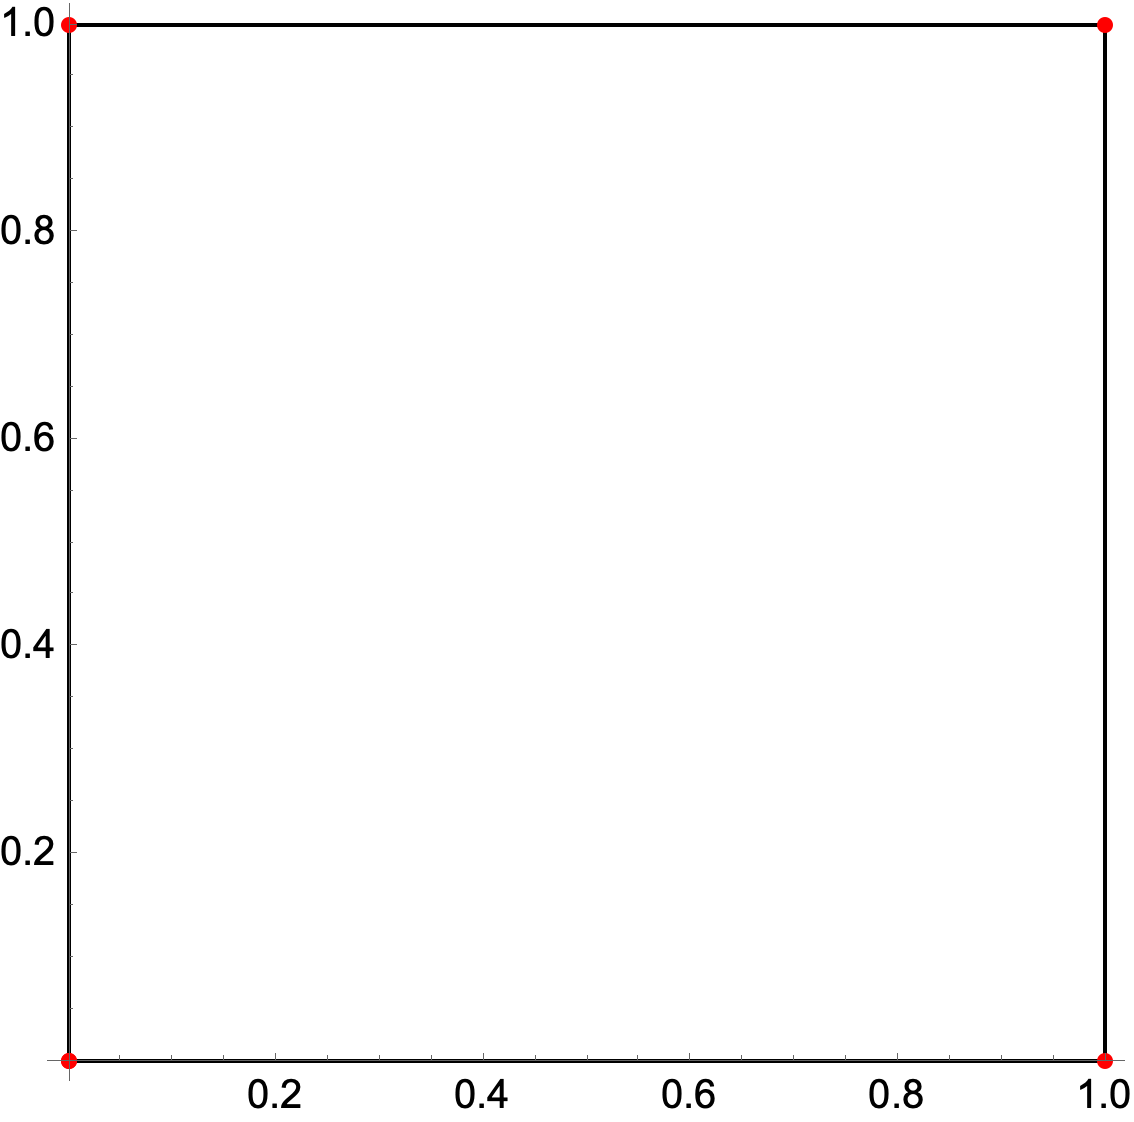
Graphics[{Line[Points[[curve[[1]]]]],
  Red, AbsolutePointSize[4], Point[Points]},
 Axes -> True]

enter image description here

$\endgroup$
2
$\begingroup$

Another option would be to use the Graphics commands:

points = {{0, 0}, {0, 1}, {1, 1}, {1, 0}, {0, 0}};
Graphics[Line[points]]

If you want the axes shown:

Show[ListPlot[points], Graphics[Line[points]], AspectRatio -> 1]
$\endgroup$
2
$\begingroup$

I think the OP's key general problem may be the ordering the points... for example if the order happened to be

points = {{0, 0}, {0, 1}, {0, 0}, {1, 1}, {1, 0}};

or indeed any other permutation of the points.

The following, based closely on Bob Hanlon's solution, solves that problem:

Graphics[
 Polygon[
  points[[#]] & /@ FindCurvePath[points]]]

with obvious EdgeForm[] and FaceForm[] directives, if desired.

$\endgroup$

Your Answer

By clicking “Post Your Answer”, you agree to our terms of service and acknowledge you have read our privacy policy.

Not the answer you're looking for? Browse other questions tagged or ask your own question.