You simply need to take the pointwise arithmetic average to minimize the mean square error on the original scale or the geometric average to minimize the mean square error on the log scale (as mentioned by @JohnMadden at https://stats.stackexchange.com/questions/600285/how-to-combine-dissimilar-curves-into-a-single-average?noredirect=1#comment1112129_600285.
Arithmetic or geometric mean? Given that you are showing the plots on a log scale, I'd vote for the geometric mean. But there might be some subject-matter reason for the arithmetic mean. (In other words, it's not just about the numbers. The decision requires subject-matter knowledge.)
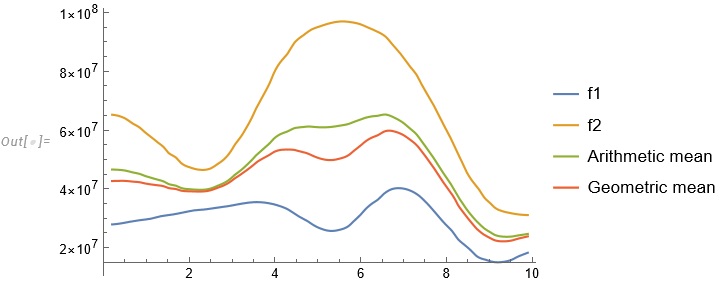
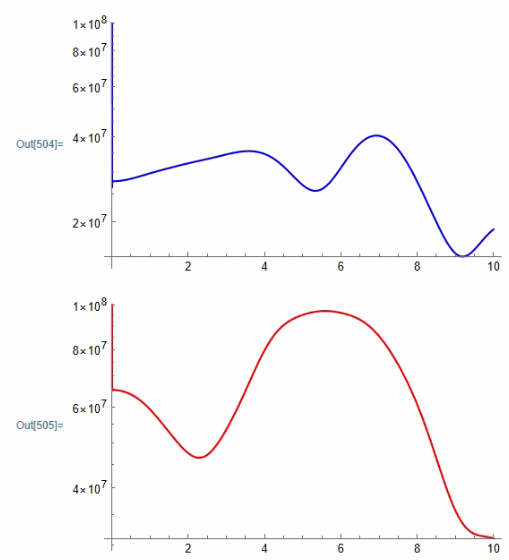
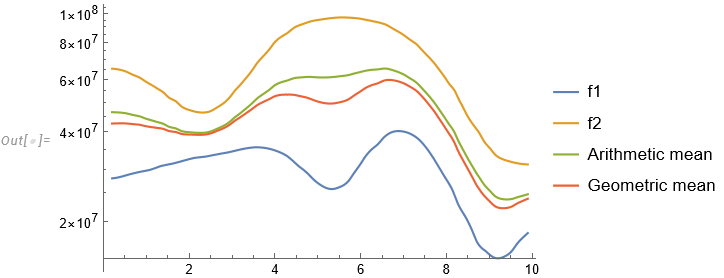
I've digitized the first two curves and linearly interpolated those points to allow for obtaining intermediate points. Here are the averages for both the arithmetic and geometric means on both a linear and log scale.
d1 = {{0.15576323987538943, 27888682.018000126}, {0.35825545171339535, 28158754.38588849}, {0.6230529595015573, 28845432.997554258}, {0.8722741433021806, 29406813.062473945}, {1.090342679127726, 29835006.339824874}, {1.339563862928349, 30710188.47782043}, {1.6199376947040498, 31307859.783459507}, {1.8380062305295948, 31917162.765987914}, {2.1183800623052953, 32695493.82126514}, {2.3676012461059184, 33012115.0739256}, {2.6635514018691584, 33654585.69674162}, {2.9127725856697815, 34144630.88853987}, {3.2242990654205608, 34977280.92032298}, {3.53582554517134, 35486585.90751357}, {3.8473520249221185, 35146231.8509037}, {4.080996884735202, 34309559.86561202}, {4.283489096573209, 33171573.6543362}, {4.548286604361371, 30710188.47782043}, {4.735202492211838, 29265452.00694473}, {4.906542056074766, 27621199.93102035}, {5.077881619937695, 26448924.71172429}, {5.3115264797507775, 25695180.5107205}, {5.498442367601245, 26069328.621623732}, {5.716510903426791, 27356283.28140367}, {5.8566978193146415, 29265452.00694473}, {6.012461059190031, 31459086.291230522}, {6.105919003115265, 33012115.0739256}, {6.277258566978192, 35146231.8509037}, {6.401869158878504, 36351960.81756076}, {6.5420560747663545, 38330793.67201461}, {6.713395638629283, 39837273.596115045}, {6.90031152647975, 40223055.42701603}, {7.149532710280373, 39455191.822792314}, {7.3676012461059175, 37599053.60231369}, {7.554517133956385, 34977280.92032298}, {7.694704049844236, 32695493.82126514}, {7.834890965732087, 30269434.549277384}, {7.975077881619936, 28023392.854738533}, {8.130841121495326, 25695180.5107205}, {8.271028037383175, 22888971.76667416}, {8.473520249221181, 20389233.238389708}, {8.598130841121494, 18695274.738905102}, {8.707165109034266, 17142052.05642869}, {8.909657320872272, 15946741.018279528}, {9.11214953271028, 15123488.170492101}, {9.361370716510903, 15269943.14668281}, {9.532710280373829, 15946741.018279528}, {9.657320872274141, 16896028.59771182}, {9.813084112149532, 17815770.359834112}, {9.999999999999998, 18876318.68762239}};
d2 = {{0.0619195046439629, 65244252.714321114}, {0.2786377708978327, 65046887.41912322}, {0.5108359133126934, 63895404.83743486}, {0.6811145510835912, 62209571.71559735}, {0.851393188854489, 60748090.107776485}, {0.9597523219814244, 59322032.119475015}, {1.1145510835913315, 57586113.22047326}, {1.2693498452012386, 55735471.84467494}, {1.4086687306501549, 54104753.50258524}, {1.5170278637770893, 52211658.28900773}, {1.6873065015479873, 50683575.00120118}, {1.8111455108359131, 48765140.464943126}, {2.0123839009287927, 47337492.13372791}, {2.2445820433436534, 46499507.4150806}, {2.492260061919504, 46911568.15660117}, {2.662538699690402, 48464548.47111898}, {2.8328173374613, 50366764.655987754}, {2.9411764705882346, 52189613.5018157}, {3.06501547987616, 55048958.105777785}, {3.219814241486068, 58064426.319180384}, {3.3436532507739933, 61064292.65827257}, {3.4674922600619187, 64409859.79302654}, {3.591331269349845, 68342842.87079988}, {3.761609907120742, 72730333.30803478}, {3.8854489164086683, 76261428.73121768}, {3.9783281733746128, 79491852.95206213}, {4.102167182662538, 82613017.385934}, {4.287925696594426, 85855154.6530389}, {4.458204334365324, 89755675.9601989}, {4.659442724458204, 92177832.45641635}, {4.845201238390092, 94106016.72419916}, {5.046439628482972, 95223206.59635475}, {5.294117647058823, 96352332.43907347}, {5.557275541795666, 96917902.25030807}, {5.789473684210526, 96624279.93399164}, {5.975232198142415, 96047636.94839196}, {6.160990712074303, 94909882.31255996}, {6.377708978328173, 93507052.27940893}, {6.594427244582042, 91580209.9077934}, {6.76470588235294, 88636695.46818762}, {6.981424148606811, 85026832.83740048}, {7.151702786377708, 81565110.50776042}, {7.306501547987615, 78710108.76580703}, {7.4458204334365305, 74837527.5384325}, {7.569659442724458, 71791634.00887407}, {7.708978328173373, 68259445.59616923}, {7.8328173374613, 64709171.1214184}, {7.9566563467492255, 61161916.4776066}, {8.06501547987616, 57981061.114540316}, {8.204334365325076, 54640112.18417334}, {8.28173374613003, 51645538.66405376}, {8.374613003095973, 48814859.884844035}, {8.467492260061917, 45866501.91267188}, {8.622291021671826, 42335454.5056284}, {8.761609907120741, 39777896.92930071}, {8.885448916408668, 37044002.75952661}, {9.024767801857585, 35117128.322678134}, {9.133126934984519, 33588264.42992504}, {9.287925696594426, 32508840.44349814}, {9.473684210526315, 31839243.046130344}, {9.659442724458202, 31368926.229139872}, {9.984520123839008, 31088108.082565922}};
f1 = Interpolation[d1];
f2 = Interpolation[d2];
Figures on a log scale:
LogPlot[{f1[x], f2[x], (f1[x] + f2[x])/2, Exp[(Log[f1[x]] + Log[f2[x]])/2]}, {x, 0.2, 9.9},
 PlotLegends -> {"f1", "f2", "Arithmetic mean", "Geometric mean"}]
Figures on a linear scale:
