2
$\begingroup$

I have 13*25 datasets consisting each of around 40 points. They are all linear I can easily fit them using fit function but my problem is when I want to call them I want them to be functions. I want to define a function using fit results

something like

Radius[s1,s2,o,i]=Fit[data[s1,s2,o],{1,x},x]

Do you have any idea how can I make this function?

any ideas?

Edit: My data is a set data of radius, {i,r(i)}

what are s1,s2 and o, Here it come in details if you are interested Molecules
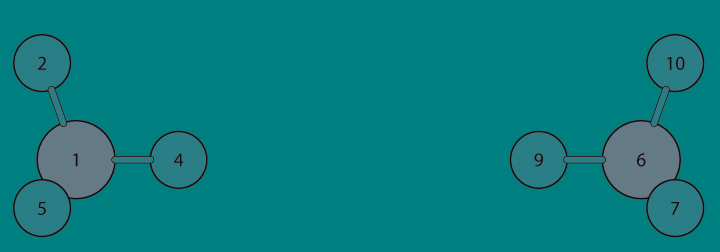
s1 is site one on molecule one and s2 is site2 on molecule 2 an o is orientation meaning the way molecules can approach each other anyways in each case we will have different radiuses between these molecules and data[s1,s2,o] is a set of 40 points for example the picture is orientation one, data[1,7,1] will be 40 points of distance between atom 1 in molecule 1 and atom 7 in molecule 2.

{{1, 6.44479}, {2, 6.34609}, {3, 6.24742}, {4, 6.1488}, {5,
6.05023}, {6, 5.9517}, {7, 5.85322}, {8, 5.7548}, {9, 5.65642}, {10,
5.55811}, {11, 5.45986}, {12, 5.36167}, {13, 5.26356}, {14,
5.16551}, {15, 5.06754}, {16, 4.96965}, {17, 4.87185}, {18,
4.77414}, {19, 4.67652}, {20, 4.57901}, {21, 4.48161}, {22,
4.38432}, {23, 4.28716}, {24, 4.19013}, {25, 4.09325}, {26,
3.99652}, {27, 3.89995}, {28, 3.80356}, {29, 3.70736}, {30,
3.61137}}

the first iterator is the step number, meaning by each step molecules get closer to each other. Thanks for your attention

$\endgroup$
5
  • $\begingroup$ radius[s1_,s2_,o_,i_]:=Fit[data[s1,s2,o],{1,x},x] ?? $\endgroup$ Commented Jun 6, 2013 at 10:18
  • $\begingroup$ Can you explain the format of your data? What are s1, s2 and o? $\endgroup$ Commented Jun 6, 2013 at 10:51
  • $\begingroup$ I'm still a bit confused. In your dataset, is i simply an index or is it an independent variable? What makes the relationship between i and r(i) linear? $\endgroup$ Commented Jun 6, 2013 at 11:55
  • $\begingroup$ i is an iterator used in coding, as i grows distance between molecules decrease, never mind that so much I just had to use it to define my functions(actually instead of i in theory we use distance between 1-6 carbon atoms). it's a part of a huge code I wreote somedays ago for my thesis. Imagine it it this way at point 1 distance between molecules 1 & 6 is equal to 6. $\endgroup$ Commented Jun 6, 2013 at 12:05
  • $\begingroup$ Thanks - Can you comment on on how my solution does not satisfactorily answer your question? Is it my assumption of your data format or the way the functions are generated? $\endgroup$ Commented Jun 6, 2013 at 12:39

1 Answer 1

5
$\begingroup$

Assumptions

I will assume that your data are contained in a nested list of {x, y} pairs such that a single dataset can be extracted via data[[i]]. We can make some example data using:

data = Transpose@Table[{x, (a + b x ) (1 + RandomReal[{-0.15, 0.15}]) /. {a -> 
    0.1 i, b -> i}}, {x, 0, 10, 1}, {i, 1, 10}];

Solution

I think LinearModelFit is a better choice than Fit as it returns functions that can be readily used for your purpose. We can Map this command over all of your datasets since they are all being fit using the general formula y = m x + b:

lmf = LinearModelFit[#, {1, x}, x] & /@ data;

lmf now contains a list of functions that can be passed to Plot, which the indices of lmf being identical to those of data.

Plot[lmf[[1]][x], {x, 1, 10}, Epilog -> Point@data[[1]]]

Your dataset is much larger than my sample set, so plotting all solutions on a single graph is not recommended, but this is one way it might be done.

Plot[Evaluate@Table[lmf[[i]][x], {i, 1, Length[lmf]}], {x, 1, 10}, Epilog -> Point@Partition[Flatten@data, 2]]
$\endgroup$

Your Answer

By clicking “Post Your Answer”, you agree to our terms of service and acknowledge you have read our privacy policy.

Not the answer you're looking for? Browse other questions tagged or ask your own question.