I'm posting this again as it hasn't solved and some weird guys just like to vote close without ever reading the post or giving a solution.
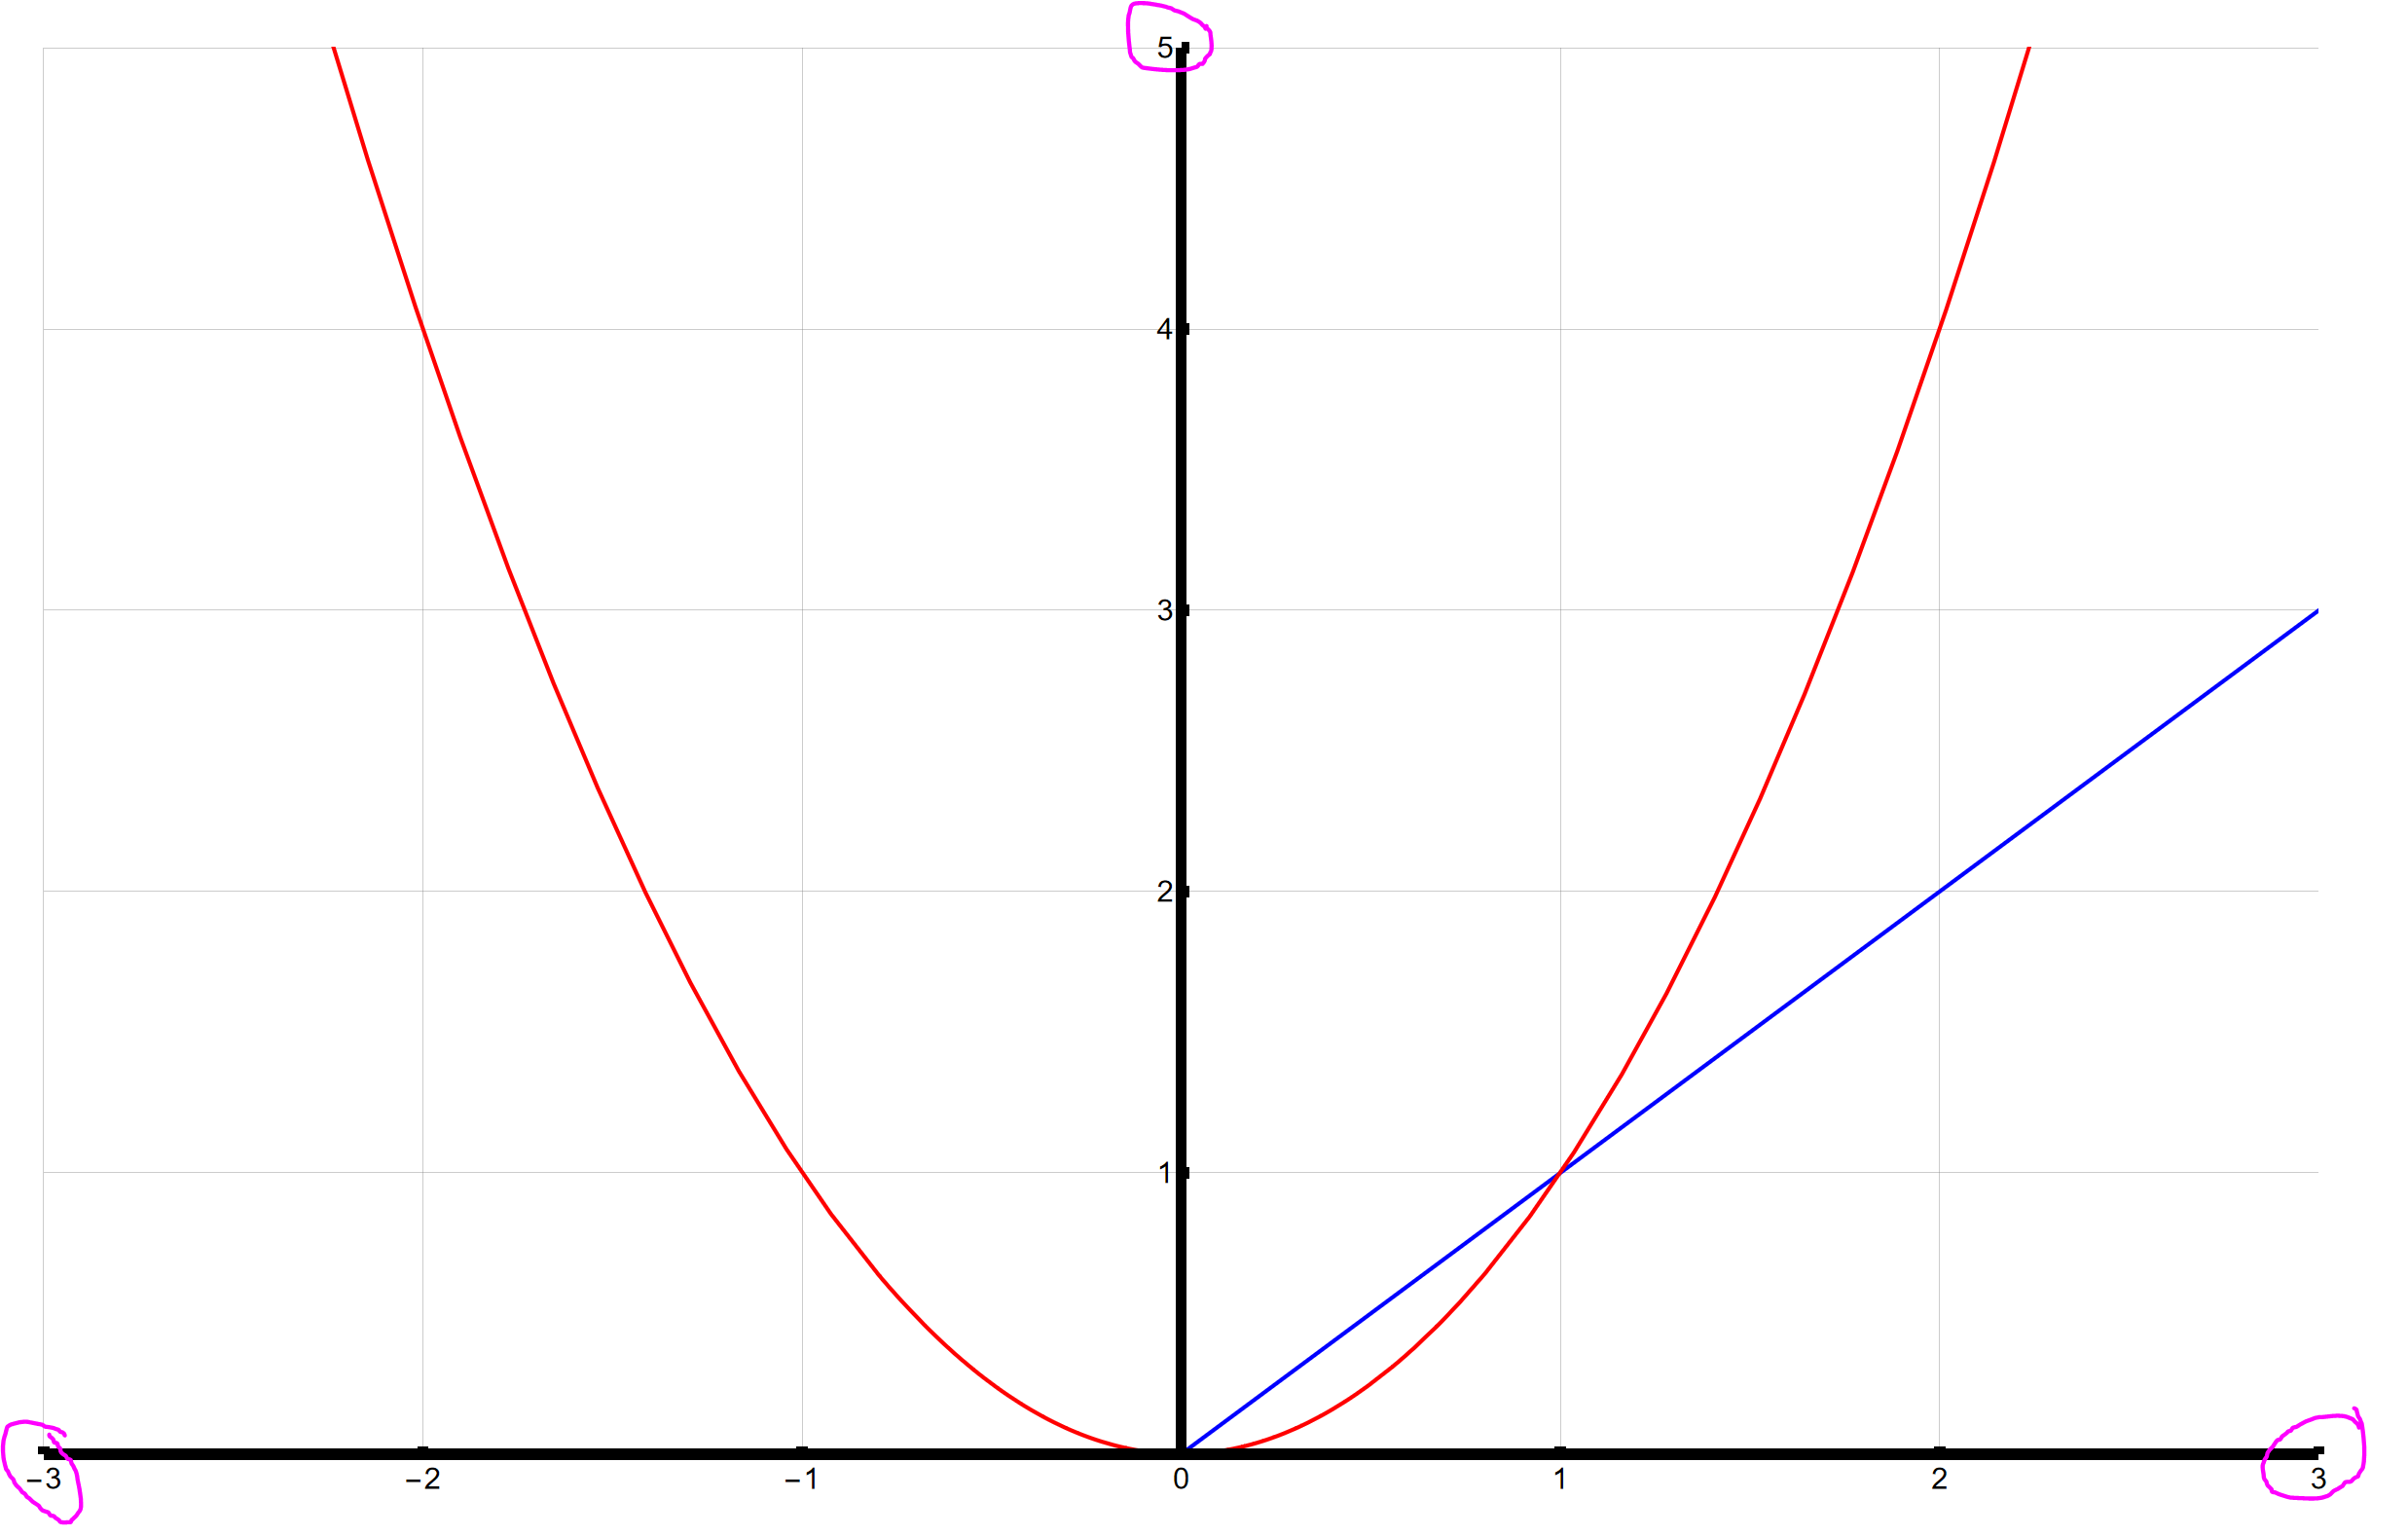
The suggestion by – Bob Hanlon does not exactly same as my question. I wanted to make the length of axes exactly same as the last tick.
Also the suggestion doesn't work in 13.0.1 for Microsoft Windows (64-bit).
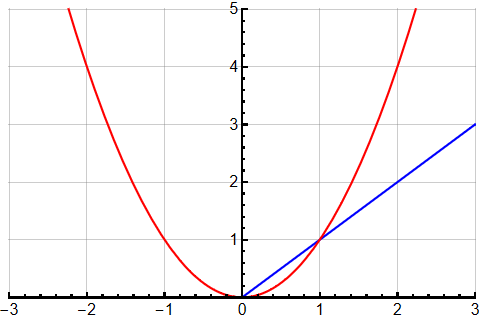
How can I make these axes longer (to the end of the last tick)?
The comment kind of works but what if I want to make them longer exactly same as the end of the last tick? Is there any way to do it other than manually trial and error?
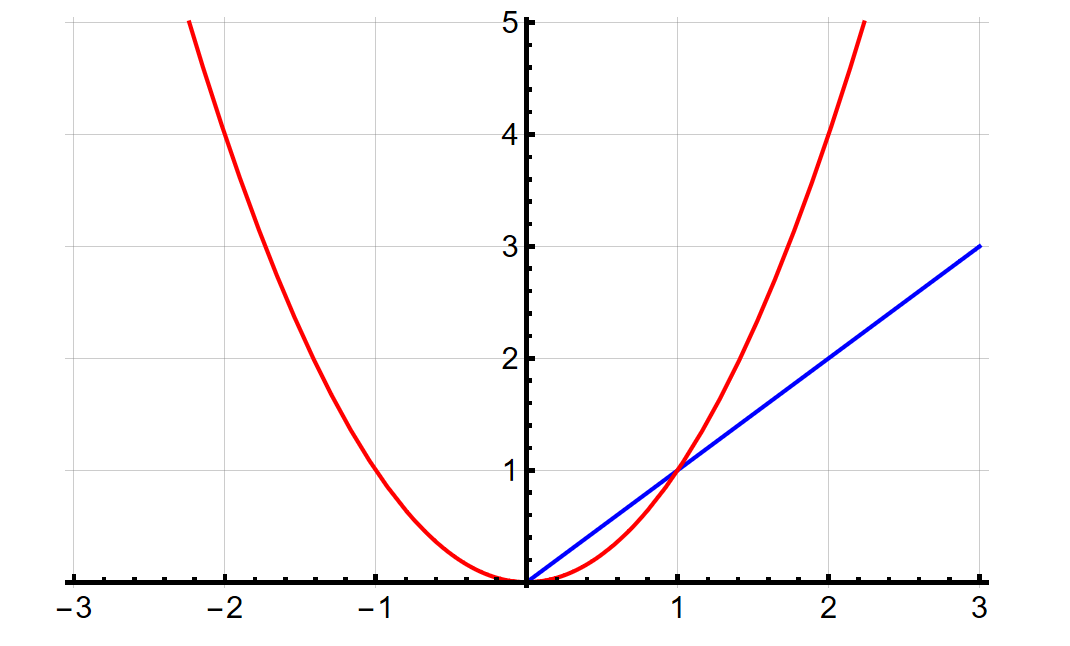
Another problem with the suggestion is that PlotRangePadding -> Scaled[.1] remove the label 0.
Show[Plot[x, {x, -3, 3}, PlotStyle -> Blue,
  PlotRange -> {{-3, 3}, {0, 5}}],
 Plot[x^2, {x, -3, 3}, PlotStyle -> Red,
  PlotRange -> {{0, 3}, {0, 5}}],
 AxesStyle -> Directive[Black, Thickness[0.005], 12],
 GridLines -> Automatic]
From suggestion with PlotRangePadding -> Scaled[.01] you can see that the label 0 is not there.
(13.0.1 for Microsoft Windows (64-bit))
Show[Plot[x, {x, -3, 3}, PlotStyle -> Blue,
  PlotRange -> {{-3, 3}, {0, 5}}],
 Plot[x^2, {x, -3, 3}, PlotStyle -> Red,
  PlotRange -> {{0, 3}, {0, 5}}],
 AxesStyle -> Directive[Black, Thickness[0.005], 12],
 GridLines -> Automatic, PlotRangePadding -> Scaled[.01]]


PlotRangePadding -> Scaled[.01]displays the0Edit your question to show what you get usingPlotRangePadding -> {Scaled[.01], {None, Scaled[.01]}}$\endgroup$