1
$\begingroup$

I want solve a differential equation for varying parameter and then I wish to create a list which contains the parameter and corresponding value of differential equation. So that I can make a List Density plot.

differential equation is

f = y'[x] == a*Cos[x] + b*Sin[x];
Table[{a,b,NDSolve[{f,y[0]==1},y,{x,1,10}]},{a,1,5},{b,1,5}]

I want to have a list with parameter and its corresponding differential equation solution, like {{a,b,value},{a',b',value},{}}. So I can use ListDensity Plot . Any suggestions are welcome

$\endgroup$
6
  • $\begingroup$ Welcome to the Mathematica Stack Exchange. Please include Mathematica code for what you have tried so far. $\endgroup$
    – Syed
    Commented Nov 17, 2022 at 8:37
  • $\begingroup$ I have added a simple example which I am trying solve $\endgroup$ Commented Nov 17, 2022 at 8:48
  • $\begingroup$ What is the meaning of " So I can use ListDensity Plot"? $\endgroup$ Commented Nov 17, 2022 at 8:55
  • $\begingroup$ At the end I want to create a list. Basically I need to make a density plot of the diff equation for varying parameters $\endgroup$ Commented Nov 17, 2022 at 8:56
  • $\begingroup$ DensityPlot of a,b and ??? or y[a,b][x]? $\endgroup$ Commented Nov 17, 2022 at 8:58

2 Answers 2

0
$\begingroup$

Useing ParametricNDSolveValue.

Clear[sol];
sol = ParametricNDSolveValue[{y'[x] == a*Cos[x] + b*Sin[x], 
    y[0] == 1}, y, {x, 1, 10}, {a, b}];
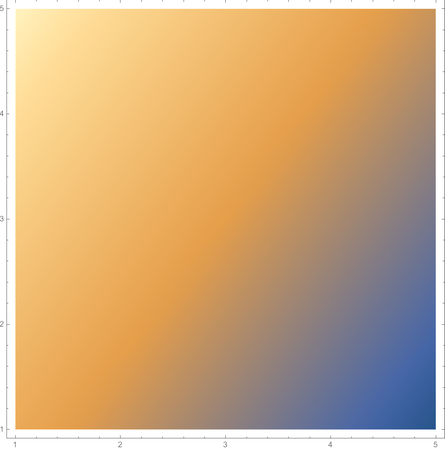
Block[{x = 5}, DensityPlot[sol[a, b]@x, {a, 1, 5}, {b, 1, 5}]]

enter image description here

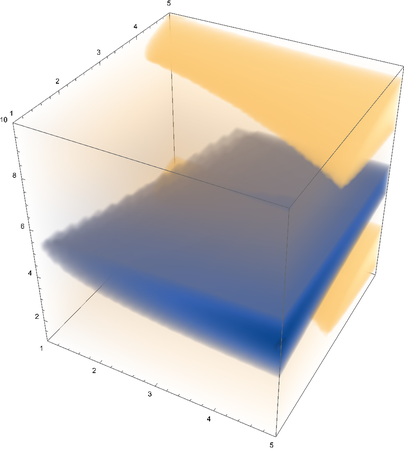
DensityPlot3D[sol[a, b]@x, {a, 1, 5}, {b, 1, 5},{x, 1, 10}]

enter image description here

$\endgroup$
4
  • $\begingroup$ Thank you for your solution. It worked. What happens if there are more than one differential equations? Then how do you plot a specific differential equation? $\endgroup$ Commented Nov 17, 2022 at 9:59
  • $\begingroup$ @physicsgeek You can ask a new equations and post a new code about it. Thanks your accption. $\endgroup$
    – cvgmt
    Commented Nov 17, 2022 at 10:01
  • $\begingroup$ I have posted a different question. I t would be nice to have some help @cvgmt $\endgroup$ Commented Nov 17, 2022 at 10:12
  • $\begingroup$ mathematica.stackexchange.com/questions/276143/… $\endgroup$ Commented Nov 17, 2022 at 10:13
0
$\begingroup$

Try NDSolveValue :

Table[{a,b,NDSolveValue[{f,y[0]==1},y,{x,1,10}]},{a,1,5},{b,1,5}]
$\endgroup$
1
  • $\begingroup$ I tried but it gives me a list which I cannot use to create a density plot using the command list density plot $\endgroup$ Commented Nov 17, 2022 at 8:58

Your Answer

By clicking “Post Your Answer”, you agree to our terms of service and acknowledge you have read our privacy policy.

Not the answer you're looking for? Browse other questions tagged or ask your own question.