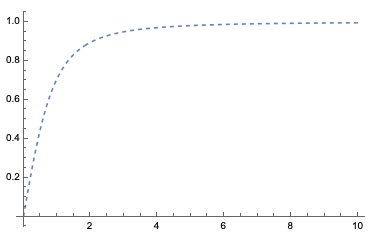
Even when plotting a seemingly simple function, Mathematica seems to screw up the dashing. If we take for instance
Plot[Sqrt[x^2/(1 + x^2)], {x, 0, 10}, PlotRange -> Full, PlotStyle -> Dashed],
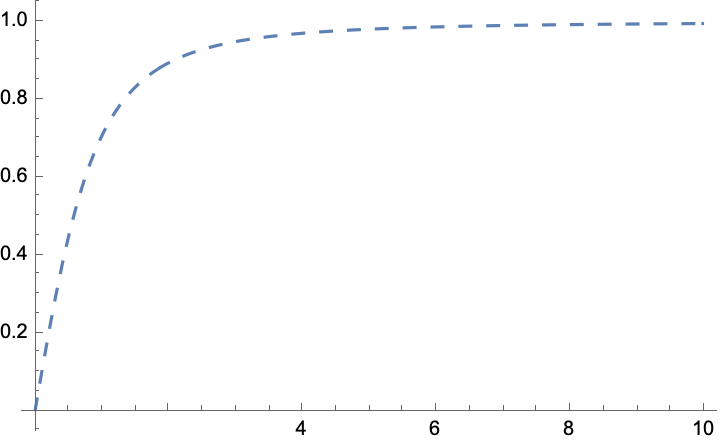
the resulting plot has uneven dashing around 2:
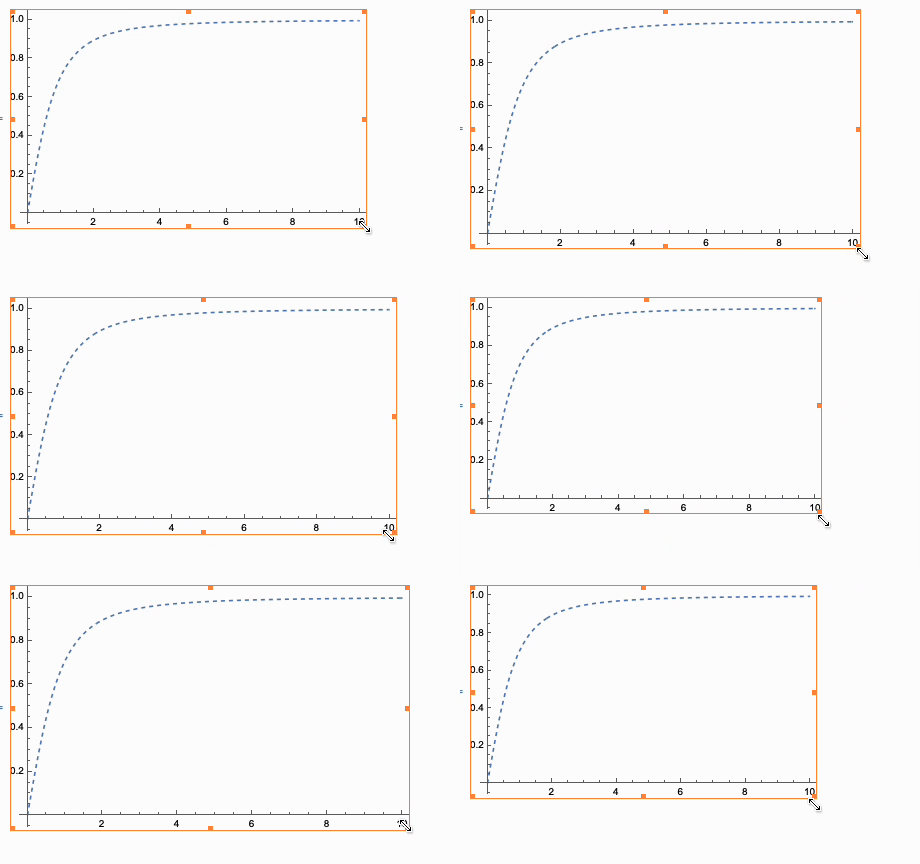
When dragging a corner of the plot, it becomes apparent that the plotted line consists of two segments. As the segments are dashed individually, it does not line up at the point where the segments meet.
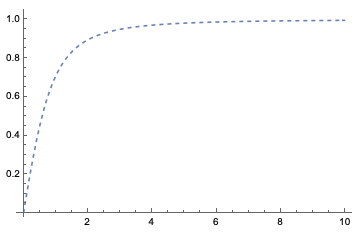
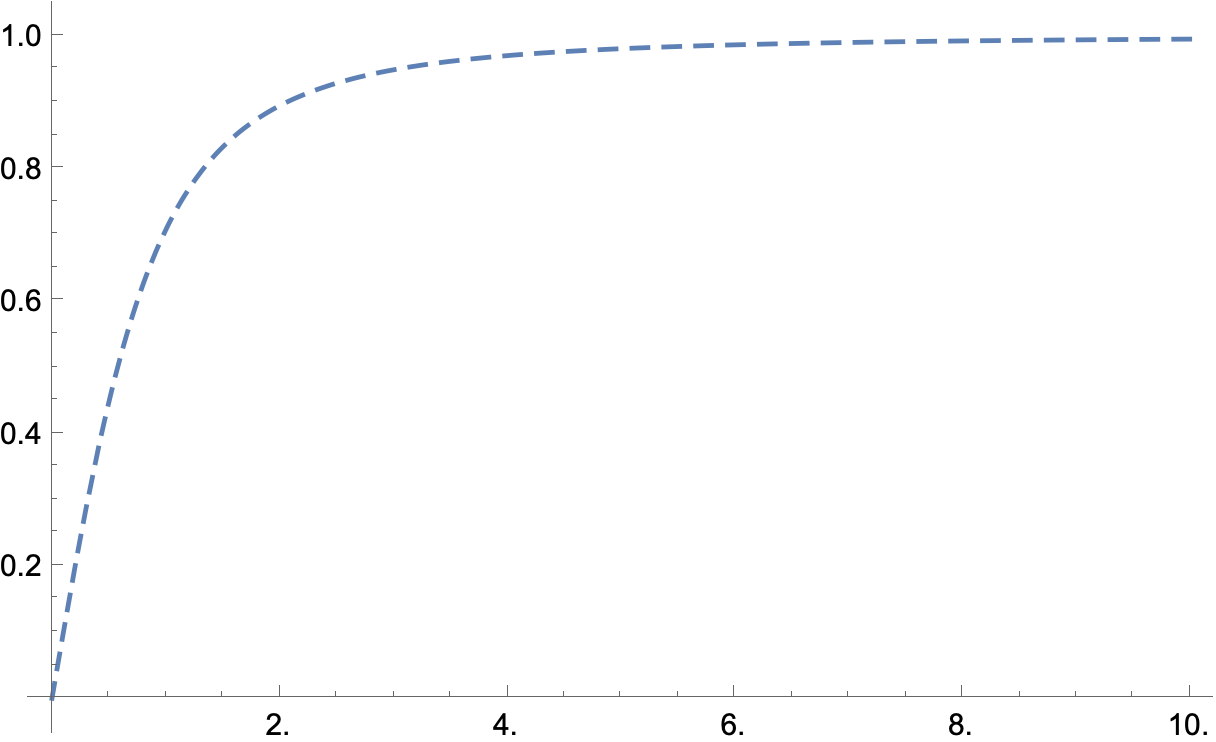
A workaround that I found is to manually evaluate the function on a mesh and doing a ListLinePlot of the results:
ListLinePlot[Table[{x, Sqrt[x^2/(1 + x^2)]}, {x, 0, 10, 0.1}], PlotRange -> Full, PlotStyle -> Dashed]
This seems a bit awkward, however, as it is the way Dashed should have behaved in the first place. So my question is: Is there any elegant way to stop Mathematica from separating the plot into segments and consequently screwing with the dashing?

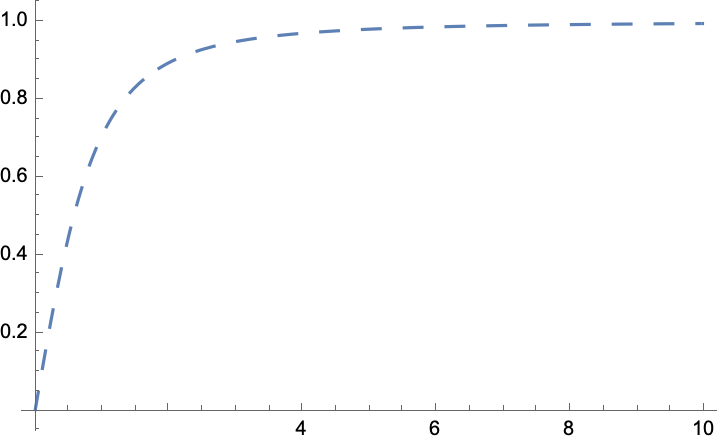
$Version? $\endgroup$PlotPointsaffects the number of "seams" and their locations. However you would need to experiment with values forPlotPointsfor eachImageSize. $\endgroup$PlotPointsto a value suitable for the plot size I chose. Using{x, 0, 10, 0.01}, I can reproduce the problem again. $\endgroup$